
Impact Assessment of US/Israel-Iran Conflict
Impact Assessment of US/Israel-Iran Conflict
- China's crude oil imports plunged 41.3% YoY to 7.12 MBpd in Jun'26, the lowest since Oct'16, while refinery throughput fell 17.7% to 12.47 MBpd, reflecting weaker demand and reliance on stockpiles during the Iran conflict.
- Although China drew about 0.94 MBpd from inventories in Jun'26 and still added around 0.53 MBpd to reserves in the first half of the year, it may increase refinery runs and fuel exports as Asian refining margins have widened.
- Two oil tankers were attacked while loading at the Caspian Pipeline Consortium (CPC) terminal on Russia's Black Sea coast, forcing the suspension of oil exports through the 1,510 KM pipeline that handles about 80% of Kazakhstan's oil exports, although no casualties or oil spill were reported.
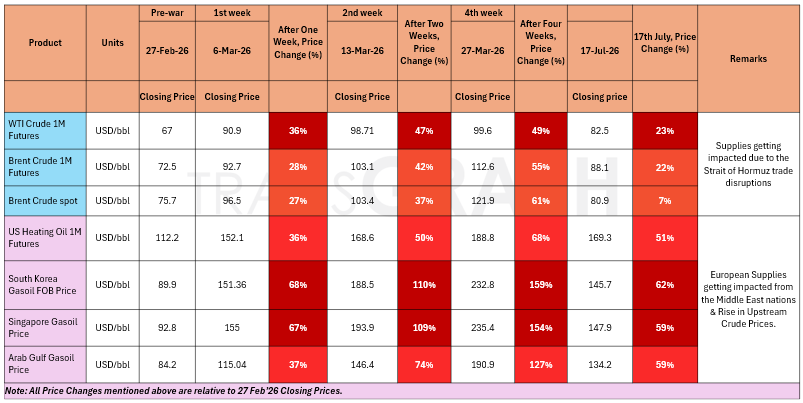
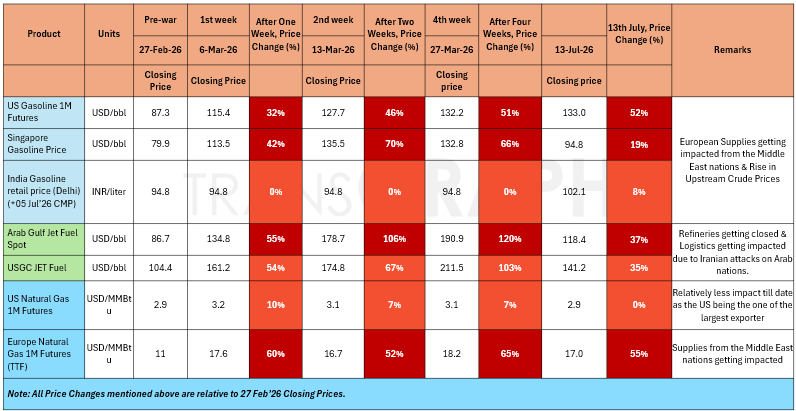
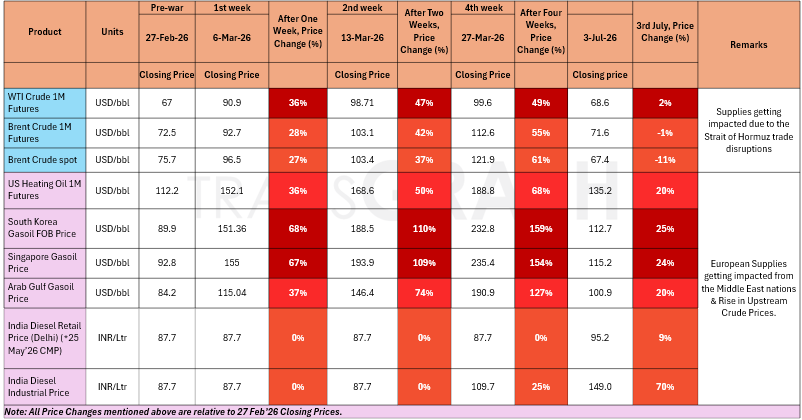
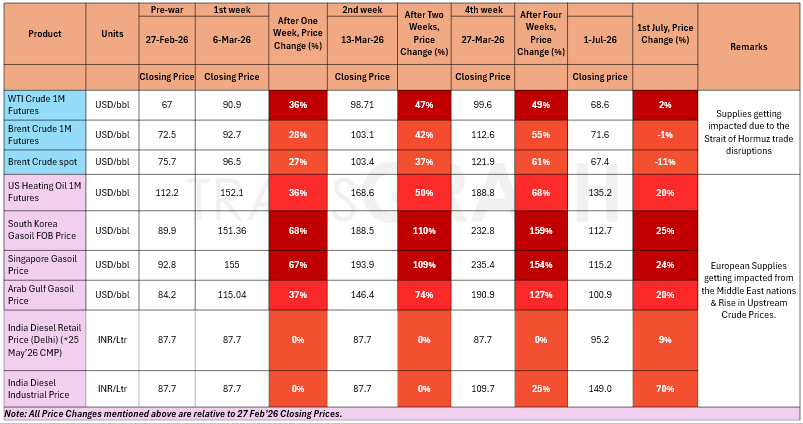
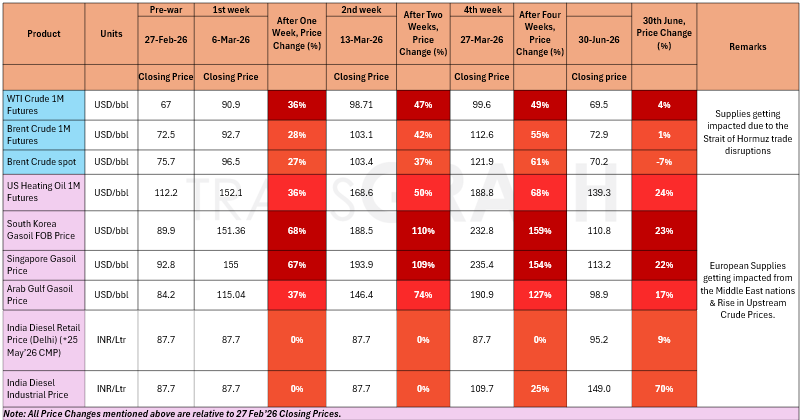
- Gulf crude and condensate exports rose 16% MoM to 12 MBpd in the first half of Jul'26, but shipments through the Strait of Hormuz have since slowed as renewed US-Iran fighting and Red Sea security risks intensified, with exports still 32% below their Feb'26 pre-war peak of 17.6 MBpd.
- Escalating US-Iran military strikes disrupted oil flows through the Strait of Hormuz and raised fears that Iran-backed Houthis could also threaten the Red Sea shipping route. The heightened geopolitical tensions have added a significant risk premium to crude prices.
- Yemen Houthi leader Abdul Malik al-Houthi warned that Saudi oil facilities, airports, and other critical infrastructure would become targets if Saudi Arabia escalates its military involvement, marking a renewed threat to regional energy security after the collapse of a four year truce.
- Iraq briefly suspended oil loadings after a drone incident near its Basra terminal before quickly resuming operations, while heightened regional security threats—including disruptions at the Khor Mor gas field and the Strait of Hormuz, continue to pose risks to the country's oil and gas exports.
- The US energy firms added seven rigs this week, bringing the total to 588, the highest since Apr'25, with oil rigs rising to 452, as the EIA forecasts US crude production to increase from a record 13.6 MBpd in 2025 to 13.8 MBpd in 2026 despite years of declining rig activity.
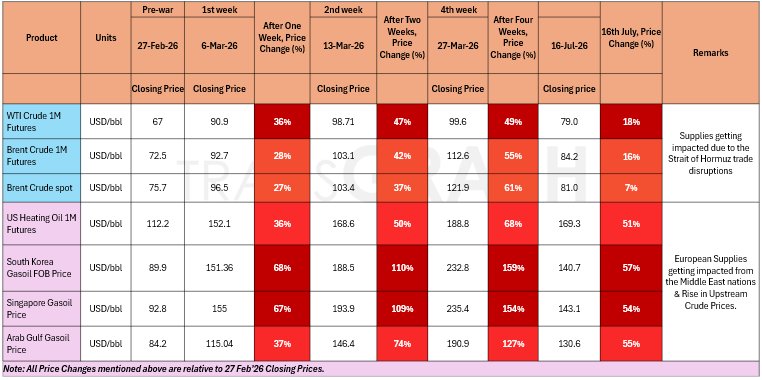
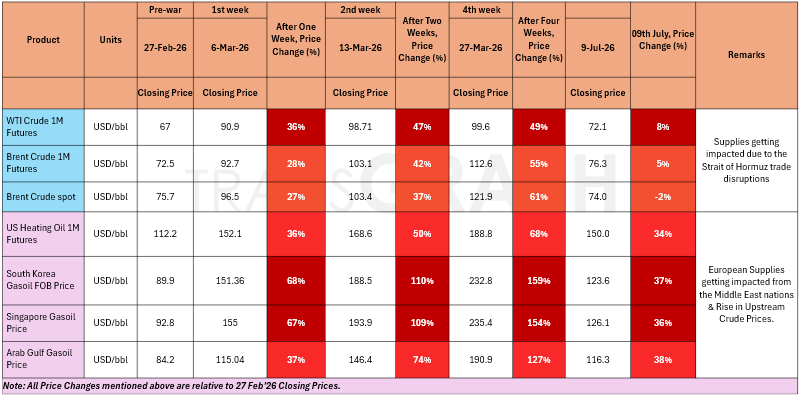
War Impact on Crude Oil & Gasoil/Diesel Prices
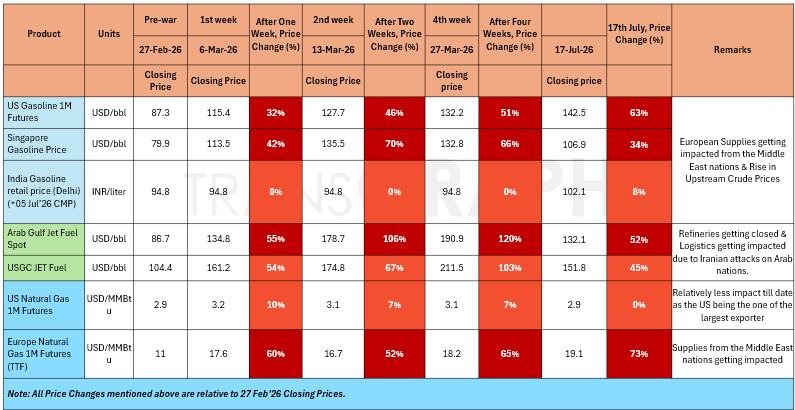
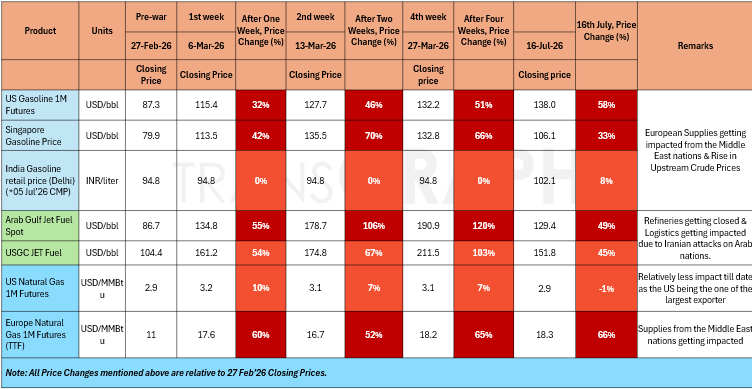
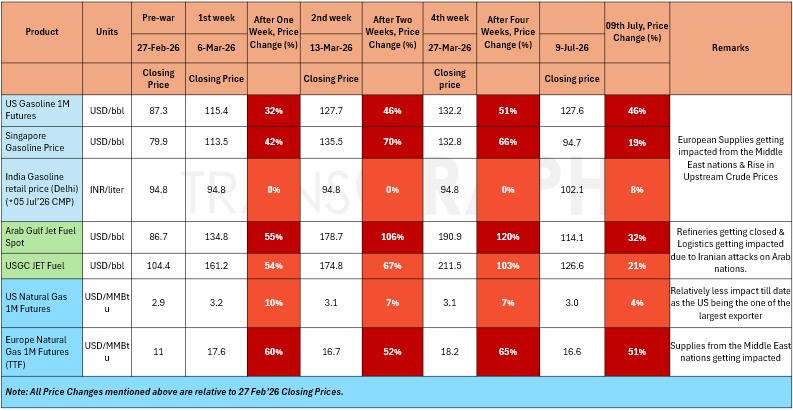
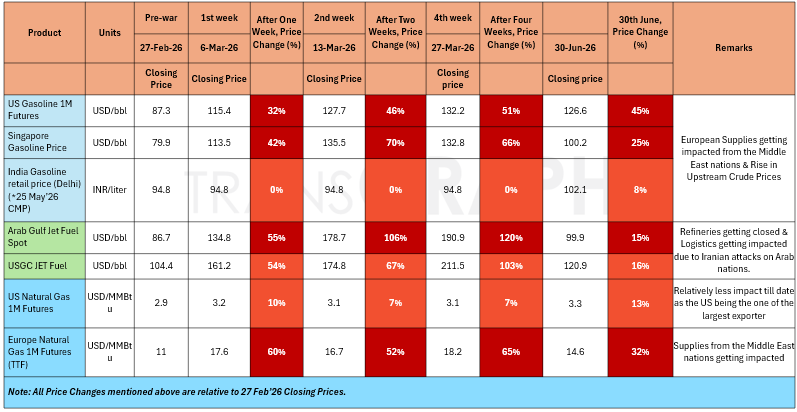
War Impact on Gasoline, ATF & Natural Gas Prices
GCC Bypass Pipelines Running Near Capacity — But Shah Gas Field Ablaze and Fujairah Zone Struck
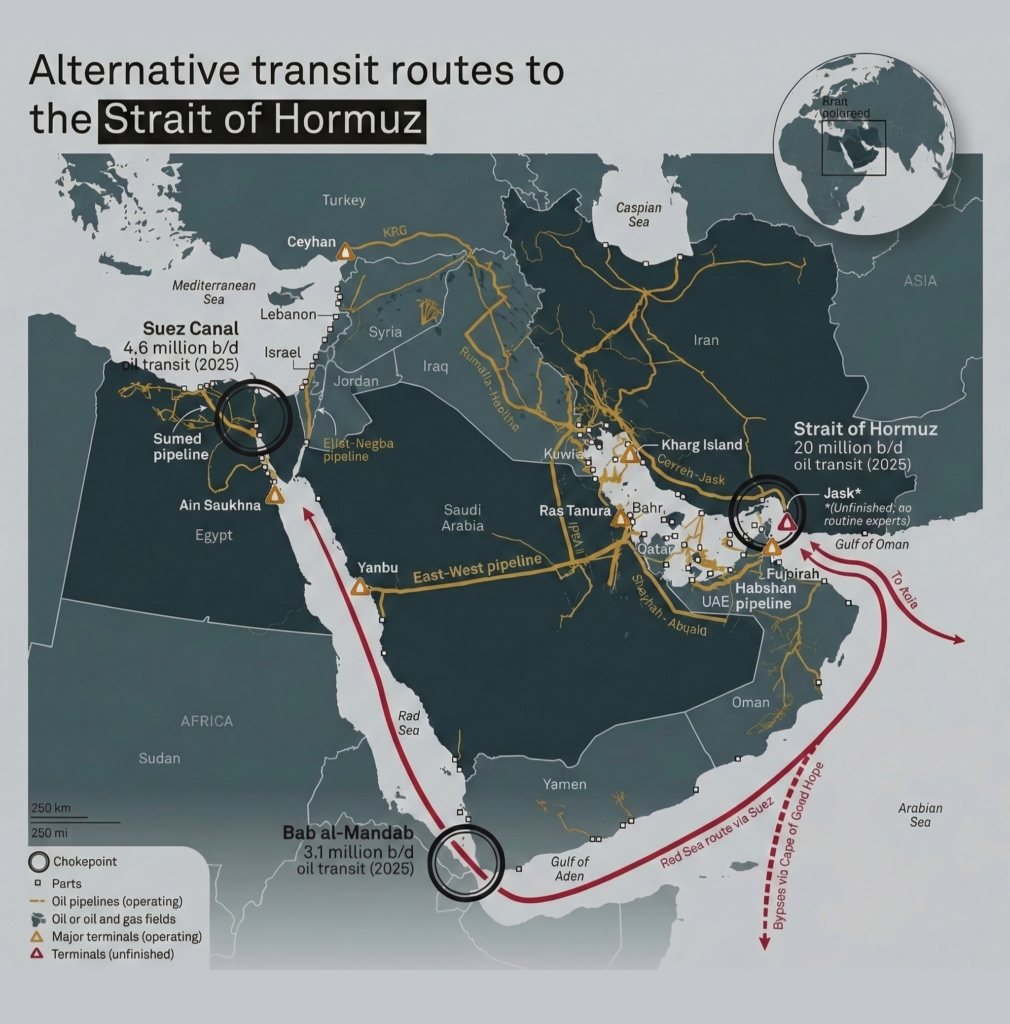
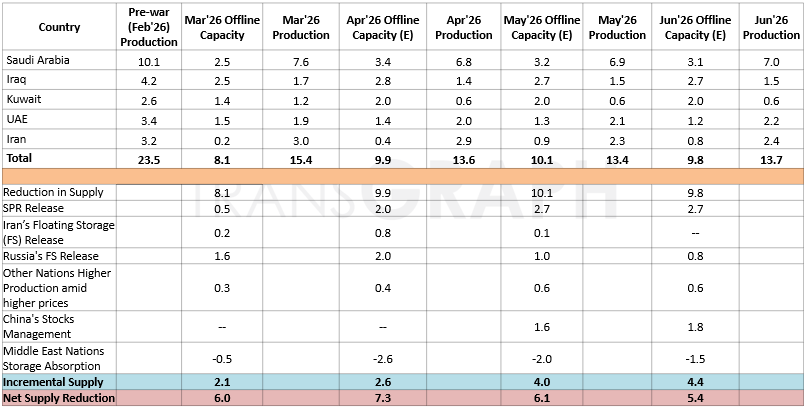
- Saudi Arabia's East-West pipeline is pumping oil at its full capacity of 7 MBpd, bypassing the Strait of Hormuz. Crude oil exports from Yanbu port have reached 5 MBpd, and the country is also exporting 0.70 to 0.90 MBpd of oil products.
- Of approximately 15 MBpd of crude transiting the Strait of Hormuz in OND'25, combined SPR releases and bypass pipeline capacity can offset roughly two-thirds — or slightly more — for the next 20 to 30 days, providing the Trump administration a window to assess strategic direction.
- New strikes directly threaten this buffer — Iranian drones struck the UAE's Shah gas field (currently ablaze) and the Fujairah Oil Industry Zone on Mar 17. A tanker was also hit near the Strait of Hormuz. Saudi Arabia intercepted over a dozen drones; Kuwait and Bahrain sustained additional attacks. These represent the first direct strikes on GCC energy export infrastructure since the conflict began.
War Scenarios Point to Global Supply Deficit of 0.92–1.07 MBpd in 2026 and AMJ Quarter Most Severe with a deficit of 4.10 MBpd.
Pre-war, global supply and demand were near-balanced with a modest surplus of +0.55 MBpd projected for 2026. Both conflict scenarios introduce significant supply deficits driven by Strait of Hormuz disruptions and impacts on Iraq and Kuwait crude production.
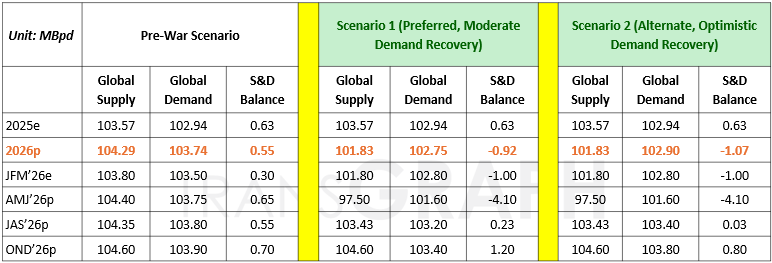
- Scenario 1 (Preferred): Ceasefire talks continue to progress positively, with tanker flows through the Strait of Hormuz gradually normalizing over the next 4–5 weeks. Supply recovers steadily, while demand improves at a slower pace and remains below pre-war expectations, resulting in a moderate market surplus.
- Scenario 2 (Alternate): The Strait of Hormuz normalizes over the next 4–5 weeks, supporting a gradual recovery in oil exports and supply. Demand rebounds more strongly than in Scenario 1, reducing the market surplus, although overall consumption remains below pre-war levels.
Geopolitical backdrop:
The conflict in the Middle East intensified further after Iran declared the June Memorandum of Understanding (MoU) with the United States effectively void. Tehran stated that the framework for de-escalation had collapsed, prompting a fresh round of military exchanges. In response, the United States launched another wave of strikes on Iranian military targets, while Iran retaliated by targeting US-linked military assets and commercial shipping in the Gulf. The conflict has now expanded beyond the US-Iran theatre. Yemen's Saudi-backed government carried out airstrikes on Sanaa International Airport, saying the strike was meant to prevent an Iranian aircraft from landing in violation of Yemeni sovereignty. The Houthis, who control Sanaa and are backed by Iran, blamed Saudi Arabia for the strikes and retaliated by launching missiles and drones at Saudi Arabia's Abha International Airport. No casualties were reported, but the attacks mark the first major escalation between the Houthis and Saudi Arabia since an informal truce took effect roughly four years ago, effectively ending that period of relative calm.
Meanwhile, Iran also intensified its operations around the Strait of Hormuz. The United States has reimposed a naval blockade on Iranian ports, raising concerns over disruptions to one of the world's most critical energy shipping routes. The renewed escalation has pushed Brent crude oil prices back to around USD 85 per barrel, as markets price in a higher geopolitical risk premium and the growing possibility of supply disruptions through the Strait of Hormuz, reinforcing expectations that interest rates could remain higher for longer.
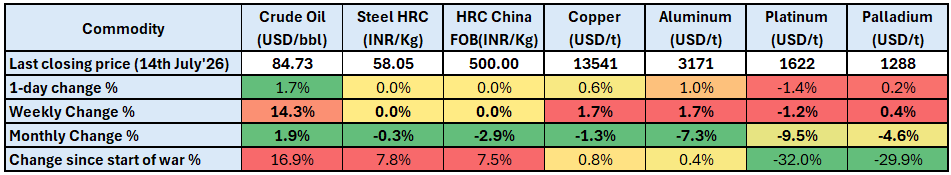
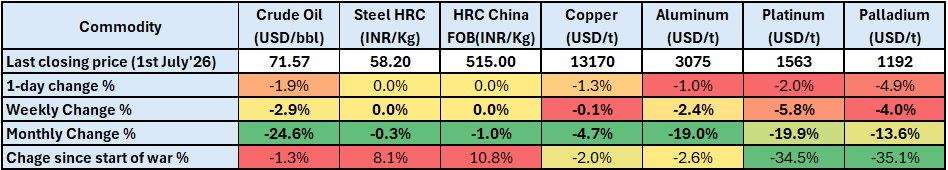
Steel:
- Domestic steel prices have moderated from recent highs.
- Steel supply chains remain largely insulated from the Middle East conflict.
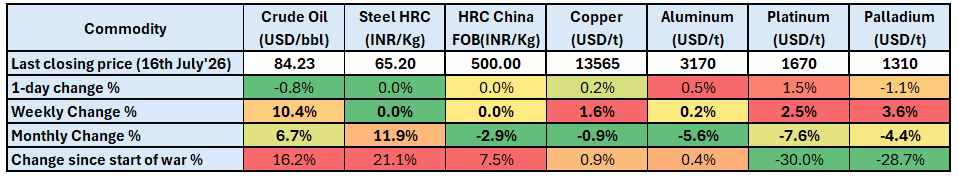
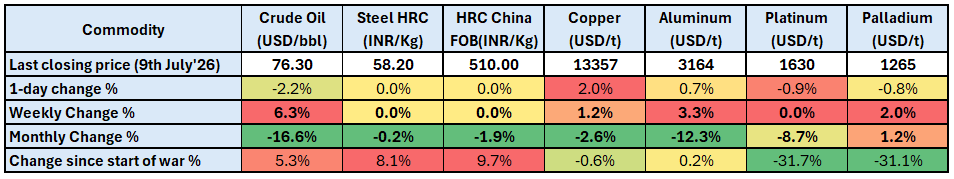
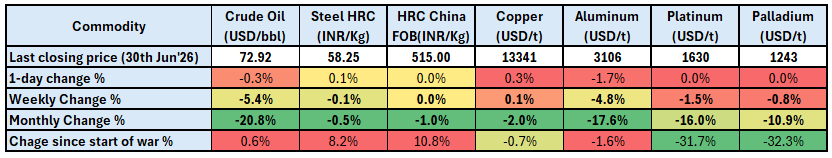
- Since, the start of war steel HRC prices are up by 21%.
Base metals:
- Copper prices are up 1.6% on a weekly basis as renewed tensions worsen sulphuric acid supply fears and softer CPI supports upward movement. However, upside remains contained by rate hike expectations.
- Renewed tensions and weaker US CPI release is supporting aluminum prices. Prices are up 0.2% on a weekly basis.
Precious metals:
- Stronger U.S. yields and weak industrial offtake, especially auto are suppressing any upside momentum.
- Stronger US Dollar due to anticipation of rate hike in US is weighing on precious metal prices.
LPG Market Update
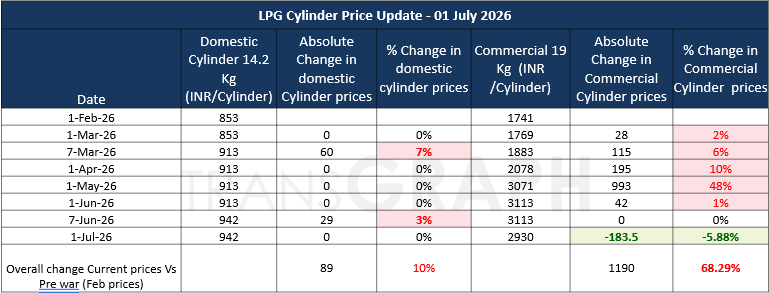
- As of 1 July 2026, India has reduced the price of the 19 kg commercial LPG cylinder by INR 183.5 per cylinder, lowering it from INR 3,113 to INR 2,930. The reduction reflects the recent easing in international LPG prices and freight rates following the de-escalation of geopolitical tensions in the Middle East, which has improved global supply conditions and reduced import costs.
- In response to the improving supply outlook, the Government has also begun rolling back several emergency measures implemented during the recent LPG supply disruption. Supplies of non-domestic packed LPG have been fully restored, while bulk LPG allocations to commercial and industrial consumers have been increased to 50% of pre-crisis consumption levels. These measures are expected to provide significant relief to LPG-dependent sectors, including manufacturing industries, hotels, restaurants, catering services, and other commercial establishments, while supporting a gradual normalization of the domestic LPG market.
Impact Assessment of US/Israel-Iran Conflict
- Escalating US-Iran military strikes disrupted oil flows through the Strait of Hormuz and raised fears that Iran-backed Houthis could also threaten the Red Sea shipping route. The heightened geopolitical tensions have added a significant risk premium to crude prices.
- Yemen Houthi leader Abdul Malik al-Houthi warned that Saudi oil facilities, airports, and other critical infrastructure would become targets if Saudi Arabia escalates its military involvement, marking a renewed threat to regional energy security after the collapse of a four year truce.
- Iraq briefly suspended oil loadings after a drone incident near its Basra terminal before quickly resuming operations, while heightened regional security threats—including disruptions at the Khor Mor gas field and the Strait of Hormuz, continue to pose risks to the country's oil and gas exports.
- China's fuel oil demand remains weak as refiners continue to favor discounted crude oil over fuel oil, with May fuel oil imports falling to a record low of 0.115 MBpd and June imports recovering only to around 0.14–0.17 MBpd, indicating a gradual recovery despite improving regional fuel oil margins.
- China's crude oil imports fell 41.3% YoY to 7.12 MBpd in Jun'26 the lowest level since Oct'16 and were down a further 12% from May'26, with seaborne imports averaging around 6.0 MBpd, Middle East supplies at a 10-year low, and Iranian crude imports dropping 40% MoM to below 0.8 MBpd as refinery utilization declined to 57.72%.
- Weak domestic fuel demand and export restrictions on refined products kept refinery run rates near a 10-year low, while China's refined oil product exports stood at approximately 1.06 MBpd in Jun'26 and averaged about 0.95 MBpd during the first half of 2026, down 13.2% YoY.
War Impact on Crude Oil & Gasoil/Diesel Prices
War Impact on Gasoline, ATF & Natural Gas Prices
GCC Bypass Pipelines Running Near Capacity — But Shah Gas Field Ablaze and Fujairah Zone Struck
- Saudi Arabia's East-West pipeline is pumping oil at its full capacity of 7 MBpd, bypassing the Strait of Hormuz. Crude oil exports from Yanbu port have reached 5 MBpd, and the country is also exporting 0.70 to 0.90 MBpd of oil products.
- Of approximately 15 MBpd of crude transiting the Strait of Hormuz in OND'25, combined SPR releases and bypass pipeline capacity can offset roughly two-thirds — or slightly more — for the next 20 to 30 days, providing the Trump administration a window to assess strategic direction.
- New strikes directly threaten this buffer — Iranian drones struck the UAE's Shah gas field (currently ablaze) and the Fujairah Oil Industry Zone on Mar 17. A tanker was also hit near the Strait of Hormuz. Saudi Arabia intercepted over a dozen drones; Kuwait and Bahrain sustained additional attacks. These represent the first direct strikes on GCC energy export infrastructure since the conflict began.
War Scenarios Point to Global Supply Deficit of 0.92–1.07 MBpd in 2026 and AMJ Quarter Most Severe with a deficit of 4.10 MBpd.
Pre-war, global supply and demand were near-balanced with a modest surplus of +0.55 MBpd projected for 2026. Both conflict scenarios introduce significant supply deficits driven by Strait of Hormuz disruptions and impacts on Iraq and Kuwait crude production.
- Scenario 1 (Preferred): Ceasefire talks continue to progress positively, with tanker flows through the Strait of Hormuz gradually normalizing over the next 4–5 weeks. Supply recovers steadily, while demand improves at a slower pace and remains below pre-war expectations, resulting in a moderate market surplus.
- Scenario 2 (Alternate): The Strait of Hormuz normalizes over the next 4–5 weeks, supporting a gradual recovery in oil exports and supply. Demand rebounds more strongly than in Scenario 1, reducing the market surplus, although overall consumption remains below pre-war levels.
Geopolitical backdrop:
The conflict in the Middle East intensified further after Iran declared the June Memorandum of Understanding (MoU) with the United States effectively void. Tehran stated that the framework for de-escalation had collapsed, prompting a fresh round of military exchanges. In response, the United States launched another wave of strikes on Iranian military targets, while Iran retaliated by targeting US-linked military assets and commercial shipping in the Gulf. The conflict has now expanded beyond the US-Iran theatre. Yemen's Saudi-backed government carried out airstrikes on Sanaa International Airport, saying the strike was meant to prevent an Iranian aircraft from landing in violation of Yemeni sovereignty. The Houthis, who control Sanaa and are backed by Iran, blamed Saudi Arabia for the strikes and retaliated by launching missiles and drones at Saudi Arabia's Abha International Airport. No casualties were reported, but the attacks mark the first major escalation between the Houthis and Saudi Arabia since an informal truce took effect roughly four years ago, effectively ending that period of relative calm.
Meanwhile, Iran also intensified its operations around the Strait of Hormuz. The United States has reimposed a naval blockade on Iranian ports, raising concerns over disruptions to one of the world's most critical energy shipping routes. The renewed escalation has pushed Brent crude oil prices back to around USD 85 per barrel, as markets price in a higher geopolitical risk premium and the growing possibility of supply disruptions through the Strait of Hormuz, reinforcing expectations that interest rates could remain higher for longer.
Steel:
- Domestic steel prices have moderated from recent highs.
- Steel supply chains remain largely insulated from the Middle East conflict.
- Since, the start of war steel HRC prices are up by 21%.
Base metals:
- Copper prices are up 1.6% on a weekly basis as renewed tensions worsen sulphuric acid supply fears and softer CPI supports upward movement. However, upside remains contained by rate hike expectations.
- Renewed tensions and weaker US CPI release is supporting aluminum prices. Prices are up 0.2% on a weekly basis.
Precious metals:
- Stronger U.S. yields and weak industrial offtake, especially auto are suppressing any upside momentum.
- Stronger US Dollar due to anticipation of rate hike in US is weighing on precious metal prices.
LPG Market Update
- As of 1 July 2026, India has reduced the price of the 19 kg commercial LPG cylinder by INR 183.5 per cylinder, lowering it from INR 3,113 to INR 2,930. The reduction reflects the recent easing in international LPG prices and freight rates following the de-escalation of geopolitical tensions in the Middle East, which has improved global supply conditions and reduced import costs.
- In response to the improving supply outlook, the Government has also begun rolling back several emergency measures implemented during the recent LPG supply disruption. Supplies of non-domestic packed LPG have been fully restored, while bulk LPG allocations to commercial and industrial consumers have been increased to 50% of pre-crisis consumption levels. These measures are expected to provide significant relief to LPG-dependent sectors, including manufacturing industries, hotels, restaurants, catering services, and other commercial establishments, while supporting a gradual normalization of the domestic LPG market.
Impact Assessment of US/Israel-Iran Conflict
- The US intensified military operations against Iran by striking coastal defense systems, missile sites, and naval infrastructure, while Iran retaliated with attacks on US military facilities across the Gulf, further escalating tensions and disrupting shipping through the Strait of Hormuz. The renewed conflict has heightened concerns over regional energy security.
- China's fuel oil demand remains weak as refiners continue to favor discounted crude oil over fuel oil, with May fuel oil imports falling to a record low of 0.115 MBpd and June imports recovering only to around 0.14–0.17 MBpd, indicating a gradual recovery despite improving regional fuel oil margins.
- The IEA has warned that the EU's methane emissions rules, set to take effect in 2027, could reduce the pool of legally importable crude by more than 50%, potentially increasing refining costs and weakening the bloc's energy security, prompting several member states to seek a delay in implementation.
- A bipartisan US Senate bill proposes tougher sanctions on Russia, including tariffs of up to 100% on major buyers of Russian oil and gas and sanctions on its shadow tanker fleet and key energy projects, while introducing exemptions for some countries and granting the President authority to waive the measures if deemed in the US national interest.
- The US Strategic Petroleum Reserve (SPR) crude oil stocks declined by 3.0 mln bbl last week to 316.5 mln bbl, the lowest since Apr'83, bringing total SPR draw downs since the onset of the US/Israel-Iran conflict to 98.9 mln bbl, while overall US crude inventories (commercial + SPR) fell to 730.8 mln bbl, the lowest level since 1984.
- China's crude oil imports fell 41.3% YoY to 7.12 MBpd in Jun'26 the lowest level since Oct'16 and were down a further 12% from May'26, with seaborne imports averaging around 6.0 MBpd, Middle East supplies at a 10-year low, and Iranian crude imports dropping 40% MoM to below 0.8 MBpd as refinery utilization declined to 57.72%.
- Weak domestic fuel demand and export restrictions on refined products kept refinery run rates near a 10-year low, while China's refined oil product exports stood at approximately 1.06 MBpd in Jun'26 and averaged about 0.95 MBpd during the first half of 2026, down 13.2% YoY.
War Impact on Crude Oil & Gasoil/Diesel Prices

War Impact on Gasoline, ATF & Natural Gas Prices

GCC Bypass Pipelines Running Near Capacity — But Shah Gas Field Ablaze and Fujairah Zone Struck
- Saudi Arabia's East-West pipeline is pumping oil at its full capacity of 7 MBpd, bypassing the Strait of Hormuz. Crude oil exports from Yanbu port have reached 5 MBpd, and the country is also exporting 0.70 to 0.90 MBpd of oil products.
- Of approximately 15 MBpd of crude transiting the Strait of Hormuz in OND'25, combined SPR releases and bypass pipeline capacity can offset roughly two-thirds — or slightly more — for the next 20 to 30 days, providing the Trump administration a window to assess strategic direction.
- New strikes directly threaten this buffer — Iranian drones struck the UAE's Shah gas field (currently ablaze) and the Fujairah Oil Industry Zone on Mar 17. A tanker was also hit near the Strait of Hormuz. Saudi Arabia intercepted over a dozen drones; Kuwait and Bahrain sustained additional attacks. These represent the first direct strikes on GCC energy export infrastructure since the conflict began.
War Scenarios Point to Global Supply Deficit of 0.92–1.07 MBpd in 2026 and AMJ Quarter Most Severe with a deficit of 4.10 MBpd.
Pre-war, global supply and demand were near-balanced with a modest surplus of +0.55 MBpd projected for 2026. Both conflict scenarios introduce significant supply deficits driven by Strait of Hormuz disruptions and impacts on Iraq and Kuwait crude production.
- Scenario 1 (Preferred): Ceasefire talks continue to progress positively, with tanker flows through the Strait of Hormuz gradually normalizing over the next 4–5 weeks. Supply recovers steadily, while demand improves at a slower pace and remains below pre-war expectations, resulting in a moderate market surplus.
- Scenario 2 (Alternate): The Strait of Hormuz normalizes over the next 4–5 weeks, supporting a gradual recovery in oil exports and supply. Demand rebounds more strongly than in Scenario 1, reducing the market surplus, although overall consumption remains below pre-war levels.
Geopolitical backdrop:
The conflict in the Middle East intensified further after Iran declared the June Memorandum of Understanding (MoU) with the United States effectively void. Tehran stated that the framework for de-escalation had collapsed, prompting a fresh round of military exchanges. In response, the United States launched another wave of strikes on Iranian military targets, while Iran retaliated by targeting US-linked military assets and commercial shipping in the Gulf. The conflict has now expanded beyond the US-Iran theatre. Yemen's Saudi-backed government carried out airstrikes on Sanaa International Airport, saying the strike was meant to prevent an Iranian aircraft from landing in violation of Yemeni sovereignty. The Houthis, who control Sanaa and are backed by Iran, blamed Saudi Arabia for the strikes and retaliated by launching missiles and drones at Saudi Arabia's Abha International Airport. No casualties were reported, but the attacks mark the first major escalation between the Houthis and Saudi Arabia since an informal truce took effect roughly four years ago, effectively ending that period of relative calm.
Meanwhile, Iran also intensified its operations around the Strait of Hormuz. The United States has reimposed a naval blockade on Iranian ports, raising concerns over disruptions to one of the world's most critical energy shipping routes. The renewed escalation has pushed Brent crude oil prices back to around USD 85 per barrel, as markets price in a higher geopolitical risk premium and the growing possibility of supply disruptions through the Strait of Hormuz, reinforcing expectations that interest rates could remain higher for longer.
Steel:
- Domestic steel prices have moderated from recent highs.
- Steel supply chains remain largely insulated from the Middle East conflict.
- Since, the start of war steel HRC prices are up by 8.1%.
Base metals:
- Copper prices are down by 1.3% on a monthly basis due to FOMC outcome, and expectations of rate hikes towards the end of the year.
- Renewed tensions and weaker US CPI release is supporting aluminum prices. Prices are up 1.7% on a weekly basis.
Precious metals:
- Stronger U.S. yields and weak industrial offtake, especially auto are suppressing any upside momentum.
- Stronger US Dollar due to anticipation of rate hike in US is weighing on precious metal prices.
LPG Market Update
- As of 1 July 2026, India has reduced the price of the 19 kg commercial LPG cylinder by INR 183.5 per cylinder, lowering it from INR 3,113 to INR 2,930. The reduction reflects the recent easing in international LPG prices and freight rates following the de-escalation of geopolitical tensions in the Middle East, which has improved global supply conditions and reduced import costs.
- In response to the improving supply outlook, the Government has also begun rolling back several emergency measures implemented during the recent LPG supply disruption. Supplies of non-domestic packed LPG have been fully restored, while bulk LPG allocations to commercial and industrial consumers have been increased to 50% of pre-crisis consumption levels. These measures are expected to provide significant relief to LPG-dependent sectors, including manufacturing industries, hotels, restaurants, catering services, and other commercial establishments, while supporting a gradual normalization of the domestic LPG market.
Impact Assessment of US/Israel-Iran Conflict
- The IEA has warned that the EU's methane emissions rules, set to take effect in 2027, could reduce the pool of legally importable crude by more than 50%, potentially increasing refining costs and weakening the bloc's energy security, prompting several member states to seek a delay in implementation.
- A bipartisan US Senate bill proposes tougher sanctions on Russia, including tariffs of up to 100% on major buyers of Russian oil and gas and sanctions on its shadow tanker fleet and key energy projects, while introducing exemptions for some countries and granting the President authority to waive the measures if deemed in the US national interest.
- The US Strategic Petroleum Reserve (SPR) crude oil stocks declined by 3.0 mln bbl last week to 316.5 mln bbl, the lowest since Apr'83, bringing total SPR draw downs since the onset of the US/Israel-Iran conflict to 98.9 mln bbl, while overall US crude inventories (commercial + SPR) fell to 730.8 mln bbl, the lowest level since 1984.
- Renewed US-Iran missile and drone exchanges have intensified tensions in the Gulf, with Iran targeting US facilities and reaffirming restrictions on the Strait of Hormuz, raising fresh concerns over regional energy security and global oil supplies.
- The escalating conflict has further undermined prospects for a lasting ceasefire, increasing geopolitical risk and supporting higher crude oil prices despite ongoing diplomatic efforts.
- China's crude oil imports fell 41.3% YoY to 7.12 MBpd in Jun'26 the lowest level since Oct'16 and were down a further 12% from May'26, with seaborne imports averaging around 6.0 MBpd, Middle East supplies at a 10-year low, and Iranian crude imports dropping 40% MoM to below 0.8 MBpd as refinery utilization declined to 57.72%.
- Weak domestic fuel demand and export restrictions on refined products kept refinery run rates near a 10-year low, while China's refined oil product exports stood at approximately 1.06 MBpd in Jun'26 and averaged about 0.95 MBpd during the first half of 2026, down 13.2% YoY.
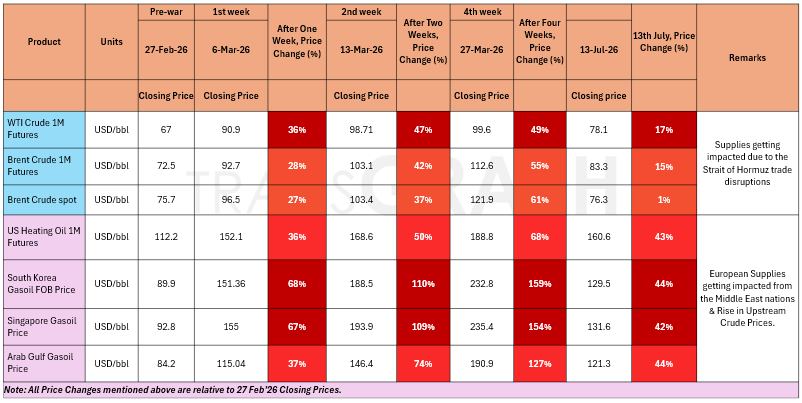
War Impact on Crude Oil & Gasoil/Diesel Prices
War Impact on Gasoline, ATF & Natural Gas Prices
GCC Bypass Pipelines Running Near Capacity — But Shah Gas Field Ablaze and Fujairah Zone Struck
- Saudi Arabia's East-West pipeline is pumping oil at its full capacity of 7 MBpd, bypassing the Strait of Hormuz. Crude oil exports from Yanbu port have reached 5 MBpd, and the country is also exporting 0.70 to 0.90 MBpd of oil products.
- Of approximately 15 MBpd of crude transiting the Strait of Hormuz in OND'25, combined SPR releases and bypass pipeline capacity can offset roughly two-thirds — or slightly more — for the next 20 to 30 days, providing the Trump administration a window to assess strategic direction.
- New strikes directly threaten this buffer — Iranian drones struck the UAE's Shah gas field (currently ablaze) and the Fujairah Oil Industry Zone on Mar 17. A tanker was also hit near the Strait of Hormuz. Saudi Arabia intercepted over a dozen drones; Kuwait and Bahrain sustained additional attacks. These represent the first direct strikes on GCC energy export infrastructure since the conflict began.
War Scenarios Point to Global Supply Deficit of 0.92–1.07 MBpd in 2026 and AMJ Quarter Most Severe with a deficit of 4.10 MBpd.
Pre-war, global supply and demand were near-balanced with a modest surplus of +0.55 MBpd projected for 2026. Both conflict scenarios introduce significant supply deficits driven by Strait of Hormuz disruptions and impacts on Iraq and Kuwait crude production.
- Scenario 1 (Preferred): Ceasefire talks continue to progress positively, with tanker flows through the Strait of Hormuz gradually normalizing over the next 4–5 weeks. Supply recovers steadily, while demand improves at a slower pace and remains below pre-war expectations, resulting in a moderate market surplus.
- Scenario 2 (Alternate): The Strait of Hormuz normalizes over the next 4–5 weeks, supporting a gradual recovery in oil exports and supply. Demand rebounds more strongly than in Scenario 1, reducing the market surplus, although overall consumption remains below pre-war levels.
Geopolitical backdrop:
The conflict in the Middle East intensified further after Iran declared the June Memorandum of Understanding (MoU) with the United States effectively void. Tehran stated that the framework for de-escalation had collapsed, prompting a fresh round of military exchanges. In response, the United States launched another wave of strikes on Iranian military targets, while Iran retaliated by targeting US-linked military assets and commercial shipping in the Gulf. The conflict has now expanded beyond the US-Iran theatre. Yemen's Saudi-backed government carried out airstrikes on Sanaa International Airport, saying the strike was meant to prevent an Iranian aircraft from landing in violation of Yemeni sovereignty. The Houthis, who control Sanaa and are backed by Iran, blamed Saudi Arabia for the strikes and retaliated by launching missiles and drones at Saudi Arabia's Abha International Airport. No casualties were reported, but the attacks mark the first major escalation between the Houthis and Saudi Arabia since an informal truce took effect roughly four years ago, effectively ending that period of relative calm.
Meanwhile, Iran also intensified its operations around the Strait of Hormuz. The United States has reimposed a naval blockade on Iranian ports, raising concerns over disruptions to one of the world's most critical energy shipping routes. The renewed escalation has pushed Brent crude oil prices back to around USD 85 per barrel, as markets price in a higher geopolitical risk premium and the growing possibility of supply disruptions through the Strait of Hormuz, reinforcing expectations that interest rates could remain higher for longer.
Steel:
- Domestic steel prices have moderated from recent highs.
- Steel supply chains remain largely insulated from the Middle East conflict.
- Since, the start of war steel HRC prices are up by 8.1%.
Base metals:
- Copper prices are down by 1.3% on a monthly basis due to FOMC outcome, and expectations of rate hikes towards the end of the year.
- Renewed tensions and weaker US CPI release is supporting aluminum prices. Prices are up 1.7% on a weekly basis.
Precious metals:
- Stronger U.S. yields and weak industrial offtake, especially auto are suppressing any upside momentum.
- Stronger US Dollar due to anticipation of rate hike in US is weighing on precious metal prices.
LPG Market Update
- As of 1 July 2026, India has reduced the price of the 19 kg commercial LPG cylinder by INR 183.5 per cylinder, lowering it from INR 3,113 to INR 2,930. The reduction reflects the recent easing in international LPG prices and freight rates following the de-escalation of geopolitical tensions in the Middle East, which has improved global supply conditions and reduced import costs.
- In response to the improving supply outlook, the Government has also begun rolling back several emergency measures implemented during the recent LPG supply disruption. Supplies of non-domestic packed LPG have been fully restored, while bulk LPG allocations to commercial and industrial consumers have been increased to 50% of pre-crisis consumption levels. These measures are expected to provide significant relief to LPG-dependent sectors, including manufacturing industries, hotels, restaurants, catering services, and other commercial establishments, while supporting a gradual normalization of the domestic LPG market.
Impact Assessment of US/Israel-Iran Conflict
- Renewed US-Iran missile and drone exchanges have intensified tensions in the Gulf, with Iran targeting US facilities and reaffirming restrictions on the Strait of Hormuz, raising fresh concerns over regional energy security and global oil supplies.
- The escalating conflict has further undermined prospects for a lasting ceasefire, increasing geopolitical risk and supporting higher crude oil prices despite ongoing diplomatic efforts.
- Iran significantly increased crude exports following the temporary US peace agreement, shipping around 62 mln bbl on 52 tankers since 14th Jun'26, but Chinese imports fell to 0.56 MBpd, the lowest since January 2023, as independent refiners shifted to discounted crude from Iraq, the UAE, and Qatar.
- The IEA has lowered its Russian oil production forecast, expecting output to average 8.9 MBpd in 2026 and 8.8 MBpd in 2027, reflecting a 3% decline due to repeated Ukrainian drone attacks on refineries and energy infrastructure, while Russia has also imposed a diesel export ban to address domestic fuel shortages.
- Despite weaker production, Russian crude exports rose to 5.8 MBpd in Jun'26 (up 0.62 MBpd from May'26) as refinery disruptions diverted more crude to overseas markets, although oil product exports fell to 1.91 MBpd, down 0.23 MBpd MoM.
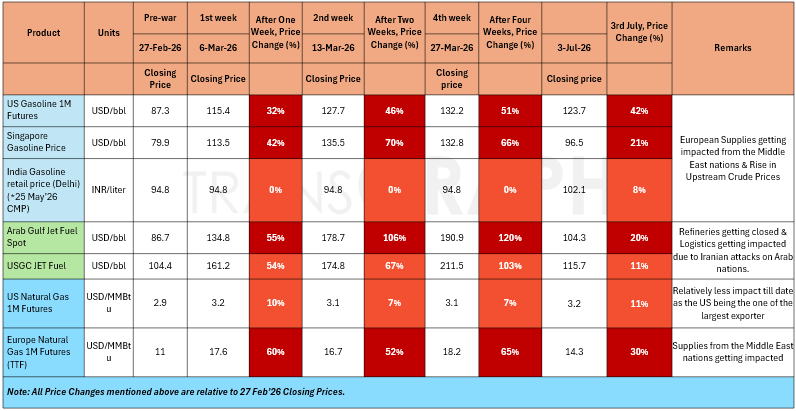
- The Iran war, Russia's diesel export ban, and limited global refining capacity have kept gasoline and diesel markets exceptionally tight, causing refining margins to surge and fuel prices to remain elevated despite relatively subdued crude oil prices.
- With global fuel inventories still below historical averages and diesel supplies constrained, fuel markets remain vulnerable to further disruptions, increasing inflationary pressures and supporting refined product prices in the near term.
- Governments are expected to rebuild strategic petroleum reserves through 2028 after record emergency stock releases during the US-Israel–Iran conflict, creating sustained additional crude oil demand that could offset part of the anticipated global supply surplus.
- The US is likely to lead the replenishment process, while countries such as Japan, South Korea, China, and India are also expected to gradually rebuild or expand their strategic reserves, providing medium-term support to crude oil prices.
War Impact on Crude Oil & Gasoil/Diesel Prices
War Impact on Gasoline, ATF & Natural Gas Prices
GCC Bypass Pipelines Running Near Capacity — But Shah Gas Field Ablaze and Fujairah Zone Struck
- Saudi Arabia's East-West pipeline is pumping oil at its full capacity of 7 MBpd, bypassing the Strait of Hormuz. Crude oil exports from Yanbu port have reached 5 MBpd, and the country is also exporting 0.70 to 0.90 MBpd of oil products.
- Of approximately 15 MBpd of crude transiting the Strait of Hormuz in OND'25, combined SPR releases and bypass pipeline capacity can offset roughly two-thirds — or slightly more — for the next 20 to 30 days, providing the Trump administration a window to assess strategic direction.
- New strikes directly threaten this buffer — Iranian drones struck the UAE's Shah gas field (currently ablaze) and the Fujairah Oil Industry Zone on Mar 17. A tanker was also hit near the Strait of Hormuz. Saudi Arabia intercepted over a dozen drones; Kuwait and Bahrain sustained additional attacks. These represent the first direct strikes on GCC energy export infrastructure since the conflict began.
War Scenarios Point to Global Supply Deficit of 0.92–1.07 MBpd in 2026 and AMJ Quarter Most Severe with a deficit of 4.10 MBpd.
Pre-war, global supply and demand were near-balanced with a modest surplus of +0.55 MBpd projected for 2026. Both conflict scenarios introduce significant supply deficits driven by Strait of Hormuz disruptions and impacts on Iraq and Kuwait crude production.
- Scenario 1 (Preferred): Ceasefire talks continue to progress positively, with tanker flows through the Strait of Hormuz gradually normalizing over the next 4–5 weeks. Supply recovers steadily, while demand improves at a slower pace and remains below pre-war expectations, resulting in a moderate market surplus.
- Scenario 2 (Alternate): The Strait of Hormuz normalizes over the next 4–5 weeks, supporting a gradual recovery in oil exports and supply. Demand rebounds more strongly than in Scenario 1, reducing the market surplus, although overall consumption remains below pre-war levels.
Geopolitical backdrop:
Indirect talks between the U.S. and Iran concluded in Doha with limited progress, focusing primarily on restoring maritime traffic through the Strait of Hormuz and the release of Iran's frozen assets. While both sides described the discussions as constructive, no breakthrough was achieved, and negotiations on Iran's nuclear program are expected to take place in a later round. The talks helped ease concerns over a renewed disruption in the Strait of Hormuz, a key route for global oil and LNG trade, contributing to a decline in oil prices. However, uncertainty persists as Iran continues to seek formal recognition of its control over the waterway and plans to introduce shipping tolls from mid-August, keeping geopolitical risks elevated for global energy markets.
While the Fed has kept interest rates unchanged, updated projections indicated an increased likelihood of a rate hike later this year, with Chair Kevin Warsh reaffirming the central bank's commitment to containing inflation. Higher Treasury yields and firm U.S. economic data continue to support the dollar.
Steel:
- Domestic steel prices have moderated from recent highs.
- Steel supply chains remain largely insulated from the Middle East conflict.
- Since, the start of war steel HRC prices are up by 8.1%.
Base metals:
- Copper prices are down by 0.6% since the start of war, primarily due to easing war tensions, FOMC outcome, and expectations of rate hikes towards the end of the year.
- Easing U.S.–Iran tensions reduced geopolitical supply risks and pushed energy prices lower, contributing to a 12.3% decline in LME aluminum prices during the month. The decline was further reinforced by the Federal Reserve's hawkish policy stance and a stronger U.S. dollar, weighing on aluminium prices.
Precious metals:
- Stronger U.S. yields and weak industrial offtake, especially auto are suppressing any upside momentum.
- Stronger US Dollar due to anticipation of rate hike in US is weighing on precious metal prices.
LPG Market Update
- As of 1 July 2026, India has reduced the price of the 19 kg commercial LPG cylinder by INR 183.5 per cylinder, lowering it from INR 3,113 to INR 2,930. The reduction reflects the recent easing in international LPG prices and freight rates following the de-escalation of geopolitical tensions in the Middle East, which has improved global supply conditions and reduced import costs.
- In response to the improving supply outlook, the Government has also begun rolling back several emergency measures implemented during the recent LPG supply disruption. Supplies of non-domestic packed LPG have been fully restored, while bulk LPG allocations to commercial and industrial consumers have been increased to 50% of pre-crisis consumption levels. These measures are expected to provide significant relief to LPG-dependent sectors, including manufacturing industries, hotels, restaurants, catering services, and other commercial establishments, while supporting a gradual normalization of the domestic LPG market.
Impact Assessment of US/Israel-Iran Conflict
- The Iran war, Russia's diesel export ban, and limited global refining capacity have kept gasoline and diesel markets exceptionally tight, causing refining margins to surge and fuel prices to remain elevated despite relatively subdued crude oil prices.
- With global fuel inventories still below historical averages and diesel supplies constrained, fuel markets remain vulnerable to further disruptions, increasing inflationary pressures and supporting refined product prices in the near term.
- Governments are expected to rebuild strategic petroleum reserves through 2028 after record emergency stock releases during the US-Israel–Iran conflict, creating sustained additional crude oil demand that could offset part of the anticipated global supply surplus.
- The US is likely to lead the replenishment process, while countries such as Japan, South Korea, China, and India are also expected to gradually rebuild or expand their strategic reserves, providing medium-term support to crude oil prices.
- The US Strategic Petroleum Reserve (SPR) fell by 6.2 mln bbl to 319.5 mln bbl in the week ended 03rd Jul'26, its lowest level since Apr'83, as part of a planned 172 mln bbl release to offset global supply disruptions from the Iran conflict and help reduce fuel prices.
- Since the conflict began in late Feb'26, combined US commercial and SPR crude inventories have declined by 120.71 mln bbl to 734 mln bbl as of Jun'26, the lowest level since 1984.
- OPEC+ agreed to raise Aug'26 crude production quotas by 0.19 MBpd, bringing total quota increases since April to about 0.80 MBpd, but actual exports remain constrained, with Middle East crude shipments at 9.62 MBpd in Jun'26 and 9.99 MBpd so far in Jul'26, well below the 18.4 MBpd average before the conflict.
- The UAE increased crude production to over 3.8 MBpd in Jun'26, the highest since Apr'20, following its exit from OPEC to remove production caps, outpacing other Gulf producers as oil markets shifted from supply disruption concerns to fears of oversupply
- A key uncertainty is demand, as China's seaborne crude imports fell to 5.84 MBpd in Jun'26 and are tracking 5.31 MBpd in Jul'26, with analysts expecting Chinese refiners to resume buying only if oil prices remain low, potentially supporting demand from August onward.
War Impact on Crude Oil & Gasoil/Diesel Prices
War Impact on Gasoline, ATF & Natural Gas Prices
GCC Bypass Pipelines Running Near Capacity — But Shah Gas Field Ablaze and Fujairah Zone Struck
- Saudi Arabia's East-West pipeline is pumping oil at its full capacity of 7 MBpd, bypassing the Strait of Hormuz. Crude oil exports from Yanbu port have reached 5 MBpd, and the country is also exporting 0.70 to 0.90 MBpd of oil products.
- Of approximately 15 MBpd of crude transiting the Strait of Hormuz in OND'25, combined SPR releases and bypass pipeline capacity can offset roughly two-thirds — or slightly more — for the next 20 to 30 days, providing the Trump administration a window to assess strategic direction.
- New strikes directly threaten this buffer — Iranian drones struck the UAE's Shah gas field (currently ablaze) and the Fujairah Oil Industry Zone on Mar 17. A tanker was also hit near the Strait of Hormuz. Saudi Arabia intercepted over a dozen drones; Kuwait and Bahrain sustained additional attacks. These represent the first direct strikes on GCC energy export infrastructure since the conflict began.
War Scenarios Point to Global Supply Deficit of 0.92–1.07 MBpd in 2026 and AMJ Quarter Most Severe with a deficit of 4.10 MBpd.
Pre-war, global supply and demand were near-balanced with a modest surplus of +0.55 MBpd projected for 2026. Both conflict scenarios introduce significant supply deficits driven by Strait of Hormuz disruptions and impacts on Iraq and Kuwait crude production.
- Scenario 1 (Preferred): Ceasefire talks continue to progress positively, with tanker flows through the Strait of Hormuz gradually normalizing over the next 4–5 weeks. Supply recovers steadily, while demand improves at a slower pace and remains below pre-war expectations, resulting in a moderate market surplus.
- Scenario 2 (Alternate): The Strait of Hormuz normalizes over the next 4–5 weeks, supporting a gradual recovery in oil exports and supply. Demand rebounds more strongly than in Scenario 1, reducing the market surplus, although overall consumption remains below pre-war levels.
Geopolitical backdrop:
Indirect talks between the U.S. and Iran concluded in Doha with limited progress, focusing primarily on restoring maritime traffic through the Strait of Hormuz and the release of Iran's frozen assets. While both sides described the discussions as constructive, no breakthrough was achieved, and negotiations on Iran's nuclear program are expected to take place in a later round. The talks helped ease concerns over a renewed disruption in the Strait of Hormuz, a key route for global oil and LNG trade, contributing to a decline in oil prices. However, uncertainty persists as Iran continues to seek formal recognition of its control over the waterway and plans to introduce shipping tolls from mid-August, keeping geopolitical risks elevated for global energy markets.
While the Fed has kept interest rates unchanged, updated projections indicated an increased likelihood of a rate hike later this year, with Chair Kevin Warsh reaffirming the central bank's commitment to containing inflation. Higher Treasury yields and firm U.S. economic data continue to support the dollar.
Steel:
- Domestic steel prices have moderated from recent highs.
- Steel supply chains remain largely insulated from the Middle East conflict.
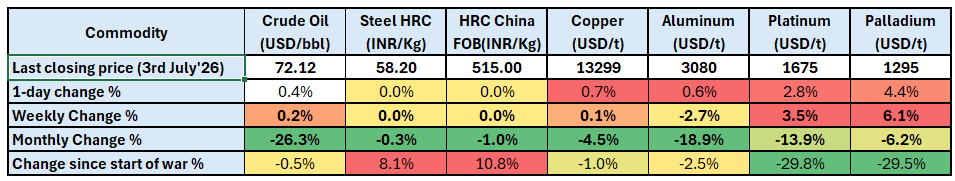
- Since, the start of war steel HRC prices are up by 8.1%.
Base metals:
- Copper prices are down by 0.6% since the start of war, primarily due to easing war tensions, FOMC outcome, and expectations of rate hikes towards the end of the year.
- Easing U.S.–Iran tensions reduced geopolitical supply risks and pushed energy prices lower, contributing to a 12.3% decline in LME aluminum prices during the month. The decline was further reinforced by the Federal Reserve's hawkish policy stance and a stronger U.S. dollar, weighing on aluminium prices.
Precious metals:
- Stronger U.S. yields and weak industrial offtake, especially auto are suppressing any upside momentum.
- Stronger US Dollar due to anticipation of rate hike in US is weighing on precious metal prices.
LPG Market Update
- As of 1 July 2026, India has reduced the price of the 19 kg commercial LPG cylinder by INR 183.5 per cylinder, lowering it from INR 3,113 to INR 2,930. The reduction reflects the recent easing in international LPG prices and freight rates following the de-escalation of geopolitical tensions in the Middle East, which has improved global supply conditions and reduced import costs.
- In response to the improving supply outlook, the Government has also begun rolling back several emergency measures implemented during the recent LPG supply disruption. Supplies of non-domestic packed LPG have been fully restored, while bulk LPG allocations to commercial and industrial consumers have been increased to 50% of pre-crisis consumption levels. These measures are expected to provide significant relief to LPG-dependent sectors, including manufacturing industries, hotels, restaurants, catering services, and other commercial establishments, while supporting a gradual normalization of the domestic LPG market.
Impact Assessment of US/Israel-Iran Conflict
- The US Strategic Petroleum Reserve (SPR) fell by 6.2 mln bbl to 319.5 mln bbl in the week ended 03rd Jul'26, its lowest level since Apr'83, as part of a planned 172 mln bbl release to offset global supply disruptions from the Iran conflict and help reduce fuel prices.
- Since the conflict began in late Feb'26, combined US commercial and SPR crude inventories have declined by 120.71 mln bbl to 734 mln bbl as of Jun'26, the lowest level since 1984.
- OPEC+ agreed to raise Aug'26 crude production quotas by 0.19 MBpd, bringing total quota increases since April to about 0.80 MBpd, but actual exports remain constrained, with Middle East crude shipments at 9.62 MBpd in Jun'26 and 9.99 MBpd so far in Jul'26, well below the 18.4 MBpd average before the conflict.
- The UAE increased crude production to over 3.8 MBpd in Jun'26, the highest since Apr'20, following its exit from OPEC to remove production caps, outpacing other Gulf producers as oil markets shifted from supply disruption concerns to fears of oversupply
- A key uncertainty is demand, as China's seaborne crude imports fell to 5.84 MBpd in Jun'26 and are tracking 5.31 MBpd in Jul'26, with analysts expecting Chinese refiners to resume buying only if oil prices remain low, potentially supporting demand from August onward.
- Vessel transits through the Strait of Hormuz have rebounded since the US-Iran ceasefire, reaching 242 crossings in the week to 28th June, but remain well below the 700-plus weekly transits seen before the conflict.
- US crude oil production climbed by 0.22 MBpd to a record 13.93 MBpd in Apr'26, with New Mexico reaching 2.37 MBpd, Texas rising to 5.83 MBpd, and North Dakota increasing to 1.13 MBpd as higher oil prices encouraged producers to boost output.
- Indian state refiners IOC and HPCL purchased about 8 mln bbl of crude through tenders last week, sourcing cargoes from Angola, Nigeria, Brazil, and Kazakhstan for delivery between Aug'26 and early Sep'26.
War Impact on Crude Oil & Gasoil/Diesel Prices
War Impact on Gasoline, ATF & Natural Gas Prices
GCC Bypass Pipelines Running Near Capacity — But Shah Gas Field Ablaze and Fujairah Zone Struck
- Saudi Arabia's East-West pipeline is pumping oil at its full capacity of 7 MBpd, bypassing the Strait of Hormuz. Crude oil exports from Yanbu port have reached 5 MBpd, and the country is also exporting 0.70 to 0.90 MBpd of oil products.
- Of approximately 15 MBpd of crude transiting the Strait of Hormuz in OND'25, combined SPR releases and bypass pipeline capacity can offset roughly two-thirds — or slightly more — for the next 20 to 30 days, providing the Trump administration a window to assess strategic direction.
- New strikes directly threaten this buffer — Iranian drones struck the UAE's Shah gas field (currently ablaze) and the Fujairah Oil Industry Zone on Mar 17. A tanker was also hit near the Strait of Hormuz. Saudi Arabia intercepted over a dozen drones; Kuwait and Bahrain sustained additional attacks. These represent the first direct strikes on GCC energy export infrastructure since the conflict began.
War Scenarios Point to Global Supply Deficit of 0.92–1.07 MBpd in 2026 and AMJ Quarter Most Severe with a deficit of 4.10 MBpd.
Pre-war, global supply and demand were near-balanced with a modest surplus of +0.55 MBpd projected for 2026. Both conflict scenarios introduce significant supply deficits driven by Strait of Hormuz disruptions and impacts on Iraq and Kuwait crude production.
- Scenario 1 (Preferred): Ceasefire talks continue to progress positively, with tanker flows through the Strait of Hormuz gradually normalizing over the next 4–5 weeks. Supply recovers steadily, while demand improves at a slower pace and remains below pre-war expectations, resulting in a moderate market surplus.
- Scenario 2 (Alternate): The Strait of Hormuz normalizes over the next 4–5 weeks, supporting a gradual recovery in oil exports and supply. Demand rebounds more strongly than in Scenario 1, reducing the market surplus, although overall consumption remains below pre-war levels.
Geopolitical backdrop:
Indirect talks between the U.S. and Iran concluded in Doha with limited progress, focusing primarily on restoring maritime traffic through the Strait of Hormuz and the release of Iran's frozen assets. While both sides described the discussions as constructive, no breakthrough was achieved, and negotiations on Iran's nuclear program are expected to take place in a later round. The talks helped ease concerns over a renewed disruption in the Strait of Hormuz, a key route for global oil and LNG trade, contributing to a decline in oil prices. However, uncertainty persists as Iran continues to seek formal recognition of its control over the waterway and plans to introduce shipping tolls from mid-August, keeping geopolitical risks elevated for global energy markets.
While the Fed has kept interest rates unchanged, updated projections indicated an increased likelihood of a rate hike later this year, with Chair Kevin Warsh reaffirming the central bank's commitment to containing inflation. Higher Treasury yields and firm U.S. economic data continue to support the dollar.
Steel:
- Domestic steel prices have moderated from recent highs.
- Steel supply chains remain largely insulated from the Middle East conflict.
- Since, the start of war steel HRC prices are up by 8.1%.
Base metals:
- Copper prices are down by 1% since the start of war, primarily due to easing war tensions, FOMC outcome, and expectations of rate hikes towards the end of the year.
- Easing U.S.–Iran tensions reduced geopolitical supply risks and pushed energy prices lower, contributing to a 17% decline in LME aluminum prices during the month. The decline was further reinforced by the Federal Reserve's hawkish policy stance and a stronger U.S. dollar, weighing on aluminium prices.
Precious metals:
- Stronger U.S. yields and weak industrial offtake, especially auto are suppressing any upside momentum.
- Stronger US Dollar due to anticipation of rate hike in US is weighing on precious metal prices.
LPG Market Update
- As of 1 July 2026, India has reduced the price of the 19 kg commercial LPG cylinder by INR 183.5 per cylinder, lowering it from INR 3,113 to INR 2,930. The reduction reflects the recent easing in international LPG prices and freight rates following the de-escalation of geopolitical tensions in the Middle East, which has improved global supply conditions and reduced import costs.
- In response to the improving supply outlook, the Government has also begun rolling back several emergency measures implemented during the recent LPG supply disruption. Supplies of non-domestic packed LPG have been fully restored, while bulk LPG allocations to commercial and industrial consumers have been increased to 50% of pre-crisis consumption levels. These measures are expected to provide significant relief to LPG-dependent sectors, including manufacturing industries, hotels, restaurants, catering services, and other commercial establishments, while supporting a gradual normalization of the domestic LPG market.
Impact Assessment of US/Israel-Iran Conflict
- OPEC+ agreed to raise August crude production quotas by 0.19 MBpd, bringing total quota increases since April to about 0.80 MBpd, but actual exports remain constrained, with Middle East crude shipments at 9.62 MBpd in Jun'26 and 9.99 MBpd so far in Jul'26, well below the 18.4 MBpd average before the conflict.
- A key uncertainty is demand, as China's seaborne crude imports fell to 5.84 MBpd in Jun'26 and are tracking 5.31 MBpd in Jul'26, with analysts expecting Chinese refiners to resume buying only if oil prices remain low, potentially supporting demand from August onward.
- Vessel transits through the Strait of Hormuz have rebounded since the US-Iran ceasefire, reaching 242 crossings in the week to 28th June, but remain well below the 700-plus weekly transits seen before the conflict.
- OPEC+ is expected to approve a further output target increase of about 0.19 MBpd for August at its Sunday meeting, despite lower prices and easing supply concerns following the reopening of the Strait of Hormuz.
- US crude oil production climbed by 0.22 MBpd to a record 13.93 MBpd in Apr'26, with New Mexico reaching 2.37 MBpd, Texas rising to 5.83 MBpd, and North Dakota increasing to 1.13 MBpd as higher oil prices encouraged producers to boost output.
- The US natural gas production edged down to 135.3 bcfd (from 135.4 bcfd in March), meanwhile total petroleum demand rose to 20.81 MBpd, gasoline demand increased to 9.12 MBpd (an eight-month high), and distillate fuel demand fell to 3.89 MBpd.
- The UAE increased crude oil and condensate exports to a record 3.7 MBpd in Jun'26, up from 3.3 MBpd earlier this year, while Abu Dhabi crude loadings reached 4.0 MBpd, supported by higher production, inventory drawdowns, and the resumption of flows through the Strait of Hormuz after leaving OPEC.
War Impact on Crude Oil & Gasoil/Diesel Prices
War Impact on Gasoline, ATF & Natural Gas Prices
GCC Bypass Pipelines Running Near Capacity — But Shah Gas Field Ablaze and Fujairah Zone Struck
- Saudi Arabia's East-West pipeline is pumping oil at its full capacity of 7 MBpd, bypassing the Strait of Hormuz. Crude oil exports from Yanbu port have reached 5 MBpd, and the country is also exporting 0.70 to 0.90 MBpd of oil products.
- Of approximately 15 MBpd of crude transiting the Strait of Hormuz in OND'25, combined SPR releases and bypass pipeline capacity can offset roughly two-thirds — or slightly more — for the next 20 to 30 days, providing the Trump administration a window to assess strategic direction.
- New strikes directly threaten this buffer — Iranian drones struck the UAE's Shah gas field (currently ablaze) and the Fujairah Oil Industry Zone on Mar 17. A tanker was also hit near the Strait of Hormuz. Saudi Arabia intercepted over a dozen drones; Kuwait and Bahrain sustained additional attacks. These represent the first direct strikes on GCC energy export infrastructure since the conflict began.
War Scenarios Point to Global Supply Deficit of 0.92–1.07 MBpd in 2026 and AMJ Quarter Most Severe with a deficit of 4.10 MBpd.
Pre-war, global supply and demand were near-balanced with a modest surplus of +0.55 MBpd projected for 2026. Both conflict scenarios introduce significant supply deficits driven by Strait of Hormuz disruptions and impacts on Iraq and Kuwait crude production.
- Scenario 1 (Preferred): Ceasefire talks continue to progress positively, with tanker flows through the Strait of Hormuz gradually normalizing over the next 4–5 weeks. Supply recovers steadily, while demand improves at a slower pace and remains below pre-war expectations, resulting in a moderate market surplus.
- Scenario 2 (Alternate): The Strait of Hormuz normalizes over the next 4–5 weeks, supporting a gradual recovery in oil exports and supply. Demand rebounds more strongly than in Scenario 1, reducing the market surplus, although overall consumption remains below pre-war levels.
Geopolitical backdrop:
Indirect talks between the U.S. and Iran concluded in Doha with limited progress, focusing primarily on restoring maritime traffic through the Strait of Hormuz and the release of Iran's frozen assets. While both sides described the discussions as constructive, no breakthrough was achieved, and negotiations on Iran's nuclear program are expected to take place in a later round. The talks helped ease concerns over a renewed disruption in the Strait of Hormuz, a key route for global oil and LNG trade, contributing to a decline in oil prices. However, uncertainty persists as Iran continues to seek formal recognition of its control over the waterway and plans to introduce shipping tolls from mid-August, keeping geopolitical risks elevated for global energy markets.
While the Fed has kept interest rates unchanged, updated projections indicated an increased likelihood of a rate hike later this year, with Chair Kevin Warsh reaffirming the central bank's commitment to containing inflation. Higher Treasury yields and firm U.S. economic data continue to support the dollar.
Steel:
- Domestic steel prices have moderated from recent highs.
- Steel supply chains remain largely insulated from the Middle East conflict.
- Since, the start of war steel HRC prices are up by 8.1%.
Base metals:
- Copper prices are down by 1% since the start of war, primarily due to easing war tensions, FOMC outcome, and expectations of rate hikes towards the end of the year.
- Easing U.S.–Iran tensions reduced geopolitical supply risks and pushed energy prices lower, contributing to a 19% decline in LME aluminum prices during the month. The decline was further reinforced by the Federal Reserve's hawkish policy stance and a stronger U.S. dollar, weighing on aluminium prices.
Precious metals:
- Stronger U.S. yields and weak industrial offtake, especially auto are suppressing any upside momentum.
- Stronger US Dollar due to anticipation of rate hike in US is weighing on precious metal prices.
LPG Market Update
- As of 1 July 2026, India has reduced the price of the 19 kg commercial LPG cylinder by INR 183.5 per cylinder, lowering it from INR 3,113 to INR 2,930. The reduction reflects the recent easing in international LPG prices and freight rates following the de-escalation of geopolitical tensions in the Middle East, which has improved global supply conditions and reduced import costs.
- In response to the improving supply outlook, the Government has also begun rolling back several emergency measures implemented during the recent LPG supply disruption. Supplies of non-domestic packed LPG have been fully restored, while bulk LPG allocations to commercial and industrial consumers have been increased to 50% of pre-crisis consumption levels. These measures are expected to provide significant relief to LPG-dependent sectors, including manufacturing industries, hotels, restaurants, catering services, and other commercial establishments, while supporting a gradual normalization of the domestic LPG market.
Impact Assessment of US/Israel-Iran Conflict
- Vessel transits through the Strait of Hormuz have rebounded since the US-Iran ceasefire, reaching 242 crossings in the week to 28th June, but remain well below the 700-plus weekly transits seen before the conflict.
- OPEC+ is expected to approve a further output target increase of about 0.19 MBpd for August at its Sunday meeting, despite lower prices and easing supply concerns following the reopening of the Strait of Hormuz.
- US crude oil production climbed by 0.22 MBpd to a record 13.93 MBpd in Apr'26, with New Mexico reaching 2.37 MBpd, Texas rising to 5.83 MBpd, and North Dakota increasing to 1.13 MBpd as higher oil prices encouraged producers to boost output.
- The US natural gas production edged down to 135.3 bcfd (from 135.4 bcfd in March), meanwhile total petroleum demand rose to 20.81 MBpd, gasoline demand increased to 9.12 MBpd (an eight-month high), and distillate fuel demand fell to 3.89 MBpd.
- The UAE increased crude oil and condensate exports to a record 3.7 MBpd in Jun'26, up from 3.3 MBpd earlier this year, while Abu Dhabi crude loadings reached 4.0 MBpd, supported by higher production, inventory drawdowns, and the resumption of flows through the Strait of Hormuz after leaving OPEC.
- ADNOC also expanded exports to markets beyond Asia, including Africa, Europe, and the US West Coast, while Gulf oil loadings excluding Iran rose 65% MoM to 7.0 MBpd in Jun'26.
- Asia's seaborne crude oil imports edged up to 20.71 MBpd in the Strait of Hormuz continued to limit Middle East oil shipments. Despite crude prices returning near pre-conflict levels, uncertainty persists over shipping security, China's reduced imports, and whether crude flows through the strait can recover enough to meet future demand.
- Russia has begun importing gasoline from India to address fuel shortages caused by Ukrainian attacks on its energy infrastructure, with at least 60,000 metric tons already shipped and plans to import up to 400,000 tons monthly from multiple countries.
- Meanwhile, India's imports of Russian crude reached a record high in June, with Russian oil accounting for more than half of the country's total crude imports.
War Impact on Crude Oil & Gasoil/Diesel Prices
War Impact on Gasoline, ATF & Natural Gas Prices

GCC Bypass Pipelines Running Near Capacity — But Shah Gas Field Ablaze and Fujairah Zone Struck
- Saudi Arabia's East-West pipeline is pumping oil at its full capacity of 7 MBpd, bypassing the Strait of Hormuz. Crude oil exports from Yanbu port have reached 5 MBpd, and the country is also exporting 0.70 to 0.90 MBpd of oil products.
- Of approximately 15 MBpd of crude transiting the Strait of Hormuz in OND'25, combined SPR releases and bypass pipeline capacity can offset roughly two-thirds — or slightly more — for the next 20 to 30 days, providing the Trump administration a window to assess strategic direction.
- New strikes directly threaten this buffer — Iranian drones struck the UAE's Shah gas field (currently ablaze) and the Fujairah Oil Industry Zone on Mar 17. A tanker was also hit near the Strait of Hormuz. Saudi Arabia intercepted over a dozen drones; Kuwait and Bahrain sustained additional attacks. These represent the first direct strikes on GCC energy export infrastructure since the conflict began.
War Scenarios Point to Global Supply Deficit of 0.92–1.07 MBpd in 2026 and AMJ Quarter Most Severe with a deficit of 4.10 MBpd.
Pre-war, global supply and demand were near-balanced with a modest surplus of +0.55 MBpd projected for 2026. Both conflict scenarios introduce significant supply deficits driven by Strait of Hormuz disruptions and impacts on Iraq and Kuwait crude production.
- Scenario 1 (Preferred): Ceasefire talks continue to progress positively, with tanker flows through the Strait of Hormuz gradually normalizing over the next 4–5 weeks. Supply recovers steadily, while demand improves at a slower pace and remains below pre-war expectations, resulting in a moderate market surplus.
- Scenario 2 (Alternate): The Strait of Hormuz normalizes over the next 4–5 weeks, supporting a gradual recovery in oil exports and supply. Demand rebounds more strongly than in Scenario 1, reducing the market surplus, although overall consumption remains below pre-war levels.
Geopolitical backdrop:
Indirect talks between the U.S. and Iran concluded in Doha with limited progress, focusing primarily on restoring maritime traffic through the Strait of Hormuz and the release of Iran's frozen assets. While both sides described the discussions as constructive, no breakthrough was achieved, and negotiations on Iran's nuclear program are expected to take place in a later round. The talks helped ease concerns over a renewed disruption in the Strait of Hormuz, a key route for global oil and LNG trade, contributing to a decline in oil prices. However, uncertainty persists as Iran continues to seek formal recognition of its control over the waterway and plans to introduce shipping tolls from mid-August, keeping geopolitical risks elevated for global energy markets.
While the Fed has kept interest rates unchanged, updated projections indicated an increased likelihood of a rate hike later this year, with Chair Kevin Warsh reaffirming the central bank's commitment to containing inflation. Higher Treasury yields and firm U.S. economic data continue to support the dollar.
Steel:
- Domestic steel prices have moderated from recent highs.
- Steel supply chains remain largely insulated from the Middle East conflict.
- Since, the start of war steel HRC prices are up by 8.1%.
Base metals:
- Copper prices are down by 2% since the start of war, primarily due to easing war tensions, FOMC outcome, and expectations of rate hikes towards the end of the year.
- Easing U.S.–Iran tensions reduced geopolitical supply risks and pushed energy prices lower, contributing to a 19% decline in LME aluminum prices during the month. The decline was further reinforced by the Federal Reserve's hawkish policy stance and a stronger U.S. dollar, weighing on aluminium prices.
Precious metals:
- Stronger U.S. yields and weak industrial offtake, especially auto are suppressing any upside momentum.
- Stronger US Dollar due to anticipation of rate hike in US is weighing on precious metal prices.
LPG Market Update
- As of 1 July 2026, India has reduced the price of the 19 kg commercial LPG cylinder by INR 183.5 per cylinder, lowering it from INR 3,113 to INR 2,930. The reduction reflects the recent easing in international LPG prices and freight rates following the de-escalation of geopolitical tensions in the Middle East, which has improved global supply conditions and reduced import costs.
- In response to the improving supply outlook, the Government has also begun rolling back several emergency measures implemented during the recent LPG supply disruption. Supplies of non-domestic packed LPG have been fully restored, while bulk LPG allocations to commercial and industrial consumers have been increased to 50% of pre-crisis consumption levels. These measures are expected to provide significant relief to LPG-dependent sectors, including manufacturing industries, hotels, restaurants, catering services, and other commercial establishments, while supporting a gradual normalization of the domestic LPG market.
Impact Assessment of US/Israel-Iran Conflict
- The US crude oil production climbed by 0.22 MBpd to a record 13.93 MBpd in Apr'26, with New Mexico reaching 2.37 MBpd, Texas rising to 5.83 MBpd, and North Dakota increasing to 1.13 MBpd as higher oil prices encouraged producers to boost output.
- The US natural gas production edged down to 135.3 bcfd (from 135.4 bcfd in March), meanwhile total petroleum demand rose to 20.81 MBpd, gasoline demand increased to 9.12 MBpd (an eight-month high), and distillate fuel demand fell to 3.89 MBpd.
- The UAE increased crude oil and condensate exports to a record 3.7 MBpd in Jun'26, up from 3.3 MBpd earlier this year, while Abu Dhabi crude loadings reached 4.0 MBpd, supported by higher production, inventory drawdowns, and the resumption of flows through the Strait of Hormuz after leaving OPEC.
- ADNOC also expanded exports to markets beyond Asia, including Africa, Europe, and the US West Coast, while Gulf oil loadings excluding Iran rose 65% MoM to 7.0 MBpd in Jun'26.
- Asia's seaborne crude oil imports edged up to 20.71 MBpd in the Strait of Hormuz continued to limit Middle East oil shipments. Despite crude prices returning near pre-conflict levels, uncertainty persists over shipping security, China's reduced imports, and whether crude flows through the strait can recover enough to meet future demand.
- The US Strategic Petroleum Reserve (SPR) stocks fell by 5.5 mln bbl to 325 mln bbl, their lowest level since May 1983, as part of a planned 172 mln bbl release to offset global supply disruptions following the Iran war. Overall US crude inventories, including commercial and SPR stocks, have dropped by 111 mln bbl to 743 mln bbl since late Feb'26.
- The US launched strikes on Iranian military sites after blaming Iran for a drone attack on a cargo ship in the Strait of Hormuz, while Iran claimed the US violated a recent ceasefire and said it retaliated by targeting US military positions in the region.
- Despite the renewed tensions, Israel and Lebanon signed an agreement aimed at ending fighting with Hezbollah, while oil exports through the Strait of Hormuz resumed and global oil prices fell as shipping activity recovered.
War Impact on Crude Oil & Gasoil/Diesel Prices
War Impact on Gasoline, ATF & Natural Gas Prices
GCC Bypass Pipelines Running Near Capacity — But Shah Gas Field Ablaze and Fujairah Zone Struck
- Saudi Arabia's East-West pipeline is pumping oil at its full capacity of 7 MBpd, bypassing the Strait of Hormuz. Crude oil exports from Yanbu port have reached 5 MBpd, and the country is also exporting 0.70 to 0.90 MBpd of oil products.
- Of approximately 15 MBpd of crude transiting the Strait of Hormuz in OND'25, combined SPR releases and bypass pipeline capacity can offset roughly two-thirds — or slightly more — for the next 20 to 30 days, providing the Trump administration a window to assess strategic direction.
- New strikes directly threaten this buffer — Iranian drones struck the UAE's Shah gas field (currently ablaze) and the Fujairah Oil Industry Zone on Mar 17. A tanker was also hit near the Strait of Hormuz. Saudi Arabia intercepted over a dozen drones; Kuwait and Bahrain sustained additional attacks. These represent the first direct strikes on GCC energy export infrastructure since the conflict began.
War Scenarios Point to Global Supply Deficit of 0.92–1.07 MBpd in 2026 and AMJ Quarter Most Severe with a deficit of 4.10 MBpd.
Pre-war, global supply and demand were near-balanced with a modest surplus of +0.55 MBpd projected for 2026. Both conflict scenarios introduce significant supply deficits driven by Strait of Hormuz disruptions and impacts on Iraq and Kuwait crude production.
- Scenario 1 (Preferred): Ceasefire talks continue to progress positively, with tanker flows through the Strait of Hormuz gradually normalizing over the next 4–5 weeks. Supply recovers steadily, while demand improves at a slower pace and remains below pre-war expectations, resulting in a moderate market surplus.
- Scenario 2 (Alternate): The Strait of Hormuz normalizes over the next 4–5 weeks, supporting a gradual recovery in oil exports and supply. Demand rebounds more strongly than in Scenario 1, reducing the market surplus, although overall consumption remains below pre-war levels.
Geopolitical backdrop:
Iran and U.S. Agree to Pause Strikes, Qatar Talks to Focus on Strait of Hormuz
- The United States and Iran have reportedly agreed to temporarily suspend military strikes and resume diplomatic talks in Doha, Qatar, on Tuesday, with securing the Strait of Hormuz emerging as the key agenda.
- The development comes after renewed hostilities threatened the June 17 understanding under which Iran agreed to ensure safe passage for commercial vessels through the strategic waterway, while the U.S. committed to lifting its blockade on Iranian ports.
- Shipping activity through the Strait of Hormuz has slowed sharply, with only 48 vessels transiting between June 26 and June 28, down from 70 and 54 vessels on the preceding two days, highlighting market concerns over potential supply disruptions.
- The temporary truce has eased immediate fears of further escalation and reduced concerns over risks to global energy supplies and maritime trade.
- Despite ongoing uncertainties, the diplomatic progress is likely to ease immediate concerns over global energy supply disruptions and geopolitical risks.
While the Fed has kept interest rates unchanged, updated projections indicated an increased likelihood of a rate hike later this year, with Chair Kevin Warsh reaffirming the central bank's commitment to containing inflation. Higher Treasury yields and firm U.S. economic data continue to support the dollar.
Steel:
- Domestic steel prices have moderated from recent highs.
- Steel supply chains remain largely insulated from the Middle East conflict.
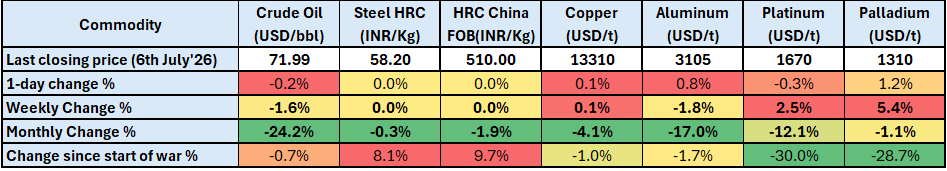
- Since, the start of war steel HRC prices are up by 8.7%.
Base metals:
- Copper prices are down by 0.7% since the start of war, primarily due to easing war tensions, FOMC outcome and expectations of rate hikes towards the end of the year.
- Easing U.S.–Iran tensions reduced geopolitical supply risks and pushed energy prices lower, contributing to a 17.6% decline in LME aluminum prices during the month. The decline was further reinforced by the Federal Reserve's hawkish policy stance and a stronger U.S. dollar, weighing on aluminium prices.
Precious metals:
- Stronger U.S. yields and weak industrial offtake, especially auto are suppressing any upside momentum.
- STronger US Dollar due to anticipation of rate hike in US is weighing on precious metal prices.
LPG Market Update
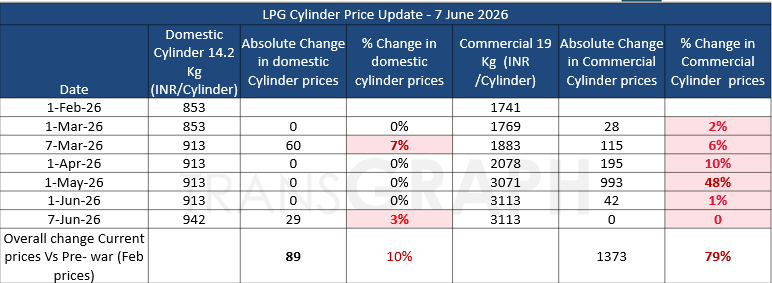
- India’s LPG market saw another upward revision on 1st June 2026 , with oil marketing companies increasing commercial cylinder prices. Commercial LPG prices were raised across major cities, with the 19 kg cylinder in Delhi increasing by Rs 42 to Rs 3,113.50. Similar hikes were reported nationwide, ranging from Rs 42 to Rs 53.50 per cylinder.
India’s domestic LPG market witnessed a price revision on 7 June 2026, with Oil Marketing Companies (OMCs) increasing the price of the 14.2 kg domestic LPG cylinder by ₹29 per cylinder across the country. - In addition to commercial cylinders, oil marketing companies also increased the price of 5 kg Free Trade LPG (FTL) cylinders by Rs 11. Following the revision, the retail price of a 5 kg FTL cylinder in Delhi now stands at Rs 821.50. FTL cylinders are sold outside the subsidized domestic LPG system and are commonly used by migrant workers, temporary households, street vendors, and consumers requiring smaller LPG packs.