
- Hopes for a peace deal on Iran faded on 12th May'26 after Donald Trump said a ceasefire with Iran was "on life support" as Tehran rejected a US proposal to end the conflict and stuck to a list of demands the US president described as "garbage".
- Iran has called for an end to the war on all fronts, including Lebanon, where US ally Israel is fighting Iran-backed Hezbollah militants. Tehran also emphasized its sovereignty over the Strait of Hormuz, demanded compensation for war damage, and an end to the US naval blockade, among other conditions.
- Market grapevine indicates OPEC oil output fell to the lowest in more than two decades in Apr'26 due to the U.S.-Israeli war with Iran, which closed the Strait of Hormuz and forced export cuts. Output dropped by 0.83 MBpd to 20.04 MBpd, with Kuwait experiencing the group's biggest production decline.
- China’s crude oil imports fell 20% YoY to 7.7 MBpd in Apr'26 (with seaborne imports at 8.03 MBpd, the lowest since Jul'22), while refined product exports dropped to 0.75 MBpd and natural gas imports declined to 1.1 MBpd amid Middle East supply disruptions.
- Despite lower imports, crude inventories increased by 0.57 MBpd (17 mln bbl build) in Apr'26, while year-to-date imports remained slightly higher at 9.1 MBpd (increased by 1.3% YoY).
- The US Treasury announced sanctions against 10 individuals and companies, including several in China and Hong Kong, for aiding Iran's efforts to secure weapons and raw materials for its Shahed drones and ballistic missiles.
- The sanctions come as efforts to end the war with Iran have stalled and before President Trump's meeting with Chinese President Xi Jinping.
- Singapore’s total onshore crude oil products stocks fell to 44.83 mln bbl (lowest since July 2025), with middle distillates down by 0.84 mln bbl to 10.08 mln bbl and residual fuel inventories at 19.88 mln bbl, near a one-year low due to disrupted Middle East supply.
GCC Bypass Pipelines Running Near Capacity — But Shah Gas Field Ablaze and Fujairah Zone Struck
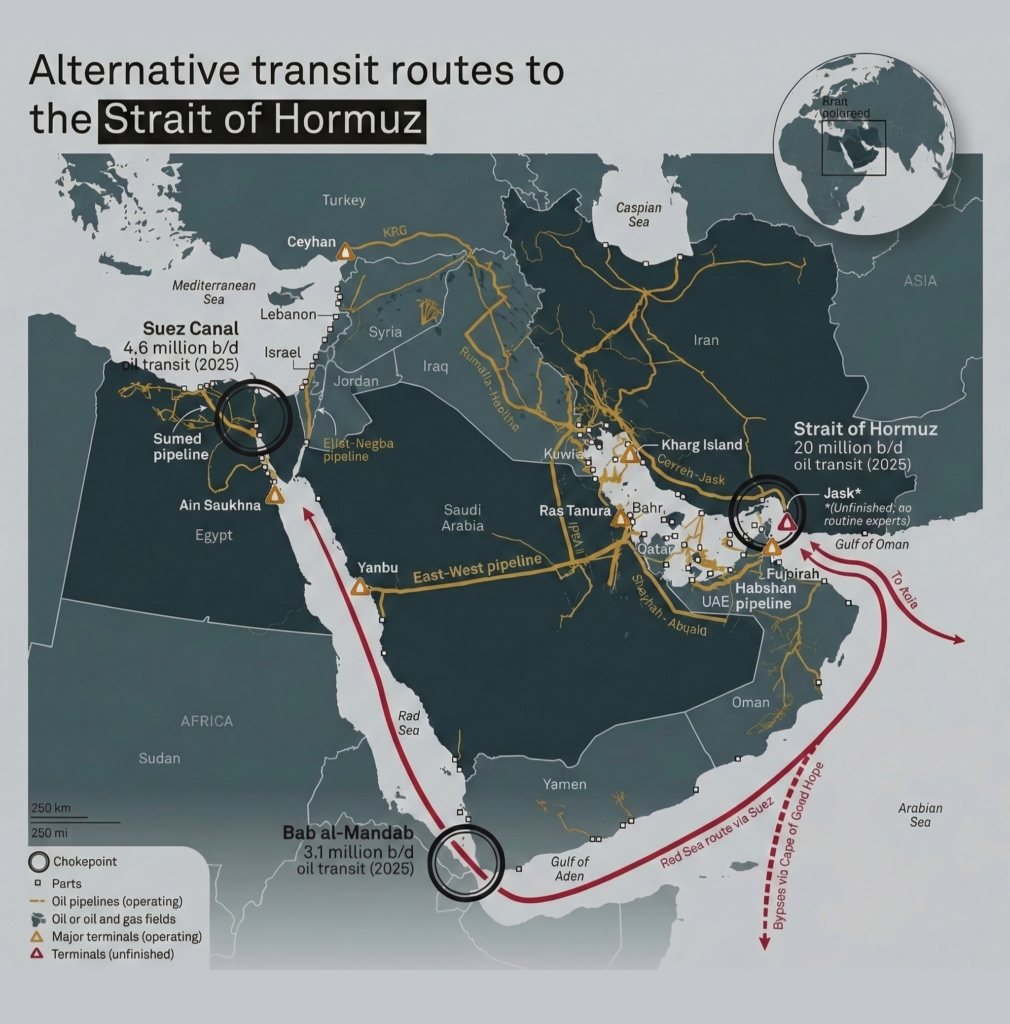
- Saudi Arabia's East-West pipeline is pumping oil at its full capacity of 7 MBpd, bypassing the Strait of Hormuz. Crude oil exports from Yanbu port have reached 5 MBpd, and the country is also exporting 0.70 to 0.90 MBpd of oil products.
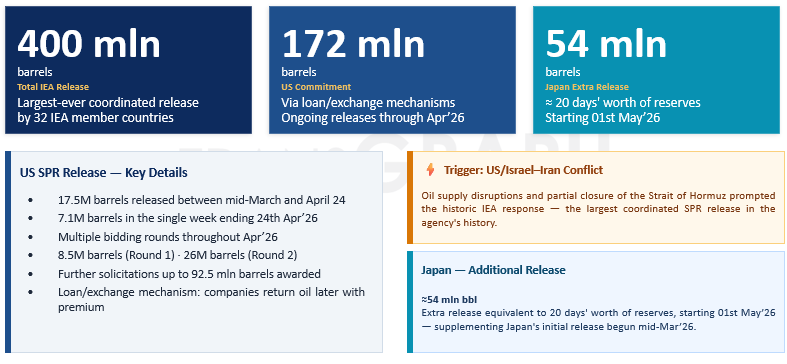
- Of approximately 15 MBpd of crude transiting the Strait of Hormuz in OND'25, combined SPR releases and bypass pipeline capacity can offset roughly two-thirds — or slightly more — for the next 20 to 30 days, providing the Trump administration a window to assess strategic direction.
- New strikes directly threaten this buffer — Iranian drones struck the UAE's Shah gas field (currently ablaze) and the Fujairah Oil Industry Zone on Mar 17. A tanker was also hit near the Strait of Hormuz. Saudi Arabia intercepted over a dozen drones; Kuwait and Bahrain sustained additional attacks. These represent the first direct strikes on GCC energy export infrastructure since the conflict began.
Supply & Demand Analysis
War Scenarios Point to Global Supply Deficit of 1.35–1.90 MBpd in 2026 and AMJ Quarter Most Severe with a deficit of 3.00 - 4.50 MBpd.
Pre-war, global supply and demand were near-balanced with a modest surplus of +0.55 MBpd projected for 2026. Both conflict scenarios introduce significant supply deficits driven by Strait of Hormuz disruptions and impacts on Iraq and Kuwait crude production.
- Scenario 1 (Preferred): Ceasefire talks to remain on a progressive note and flows through the Strait of Hormuz improving over the coming weeks; however crude oil production losses will be there due to further non-availability of storage on on-shore in Iraq, Kuwait and other small Middle East nations.
- Scenario 2 (Alternate): No major deal being achieved from ceasefire talks and post completion of ceasefire talks, tensions continuing to remain in the Middle East and flows through the Strait of Hormuz continuing to remain restrained. Crude Oil Production Facilities & Refining Centers in the Middle East region getting affected and trade disruptions in Strait of Hormuz will be there for medium to long term (4 to 7 months).
Brent Crude 1M Futures are expected to trade in a range of 100 USD/bbl to 125 USD/bbl over the coming 1 to 2 weeks. The coordinated SPR release and GCC bypass capacity provide a meaningful supply cushion that limits sustained upside beyond these levels.
Metals & Energy Market Update – Geopolitical Context (Iran Conflict)
Geopolitical backdrop: U.S.-Iran ceasefire negotiations advance, but long-term deal remains uncertain, extending uncertainty in the region and sustaining volatility across commodities.
The United States and Iran are reportedly approaching a limited short-term ceasefire agreement aimed at preventing further escalation in the Middle East conflict, although prospects for a comprehensive settlement remain constrained by persistent disagreements surrounding Iran’s nuclear program and its stockpile of highly enriched uranium. Current negotiations, are focused on establishing an interim framework that would formalize a cessation of hostilities, ensure the reopening and stabilization of shipping flows through the Strait of Hormuz, and create a 30-day window for broader diplomatic negotiations. Nevertheless, substantial gaps between Washington and Tehran continue to limit visibility on a durable long-term resolution.
Steel:
- Domestic steel prices have moderated from recent highs.
- Steel supply chains remain largely insulated from the Middle East conflict.
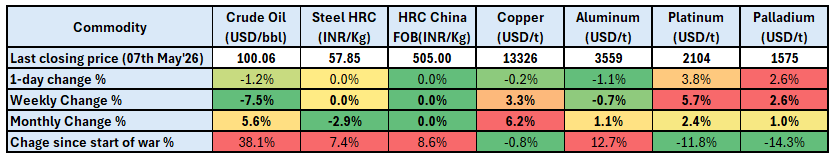
- Hot-rolled coil prices declined by ~INR 1,800/ton in April ’26, ending at ~INR 57,850/ton (BigMint).
- Initial war-driven risk premium has been partially unwound.
Base metals:
- Copper ended last week up by 3.3%, primarily due to supply risks linked to sulphuric acid.
- Aluminum fell by 0.7% despite earlier gains linked to Gulf region supply disruptions — demand softness now driving price action.
- IMF downgraded 2026 global growth to 3.1% (from 3.3% earlier and 3.4% in 2025), highlighting war-related downside risks.
Precious metals:
- Volatility has eased, but prices face upward pressure, due to improving market sentiment in peace talks.
- However, any esclation and halt in a resolution will pressure on Precious Metals.
- Stronger U.S. yields and weak industrial offtake—especially auto—are suppressing any upside momentum.
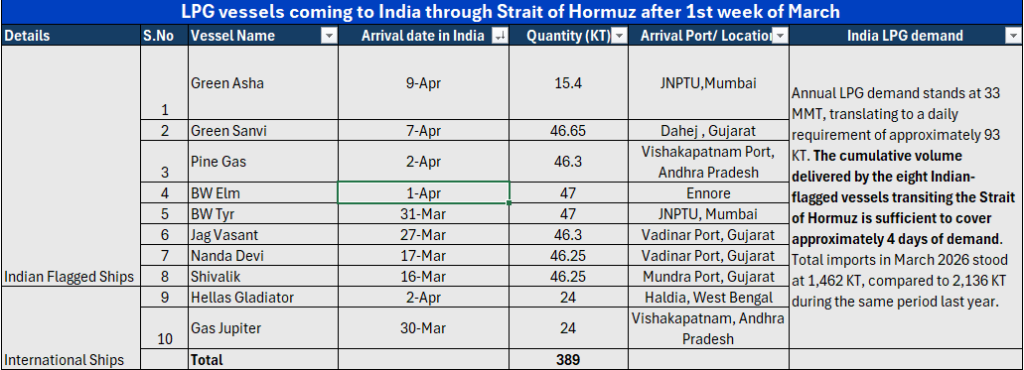
08th Indian-flagged LPG vessel has transited the Strait of Hormuz and reached India
India’s LPG import slump in March'26 signals Gulf disruption impact, triggers strategic shift toward US supply
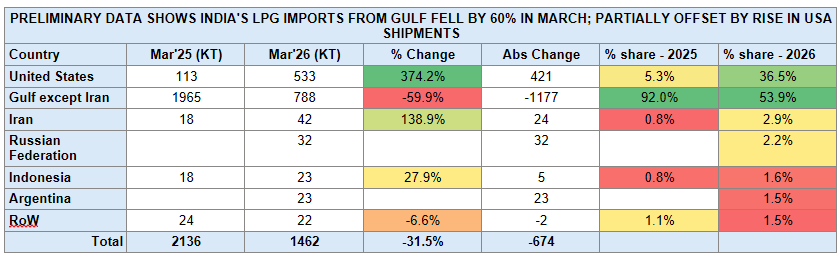
- India’s LPG import profile shifted sharply in March, with total volumes declining 31.5% MoM to 1,462 KT (down 674 KT), driven by a steep 59.9% drop in Gulf supplies (ex-Iran) to 788 KT (-1,177 KT), reducing their share from 92.0% to 53.9% amid disruptions around the Strait of Hormuz.
- This was partially offset by a surge in imports from the United States, which rose 374% MoM to 533 KT (+421 KT), lifting its share to 36.5%, alongside incremental volumes from Iran (42 KT, +139%), the Russian Federation (32 KT), Indonesia (23 KT, +27.9%), and Argentina (23 KT).
- Despite this rebalancing, the shift toward long-haul cargoes implies higher freight intensity and longer supply chains, reinforcing near-term tightness and upward pressure on delivered LPG costs.
IOCL Price Update — 1 May 2026
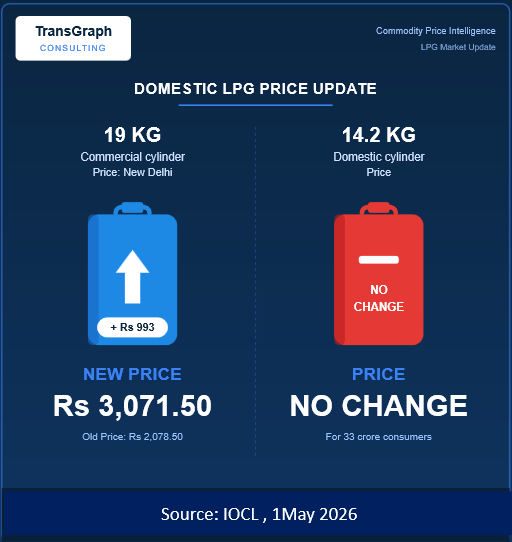
- Unchanged: Retail Petrol, Diesel, Domestic LPG (14.2 kg @ Rs 913 in Delhi), ATF for domestic airlines, and PDS Kerosene — covering -80% of petroleum products.
Revised upward:
• 19 kg Commercial LPG: +Rs 993 (Delhi: Rs 2,078.50 → Rs 3,071.50; Mumbai: Rs 2,031 → Rs 3,024)
• 5 kg Free Trade LPG (FTL): +Rs 261 per cylinder.