
Impact Assessment of US/Israel-Iran Conflict
Impact Assessment of US/Israel-Iran Conflict
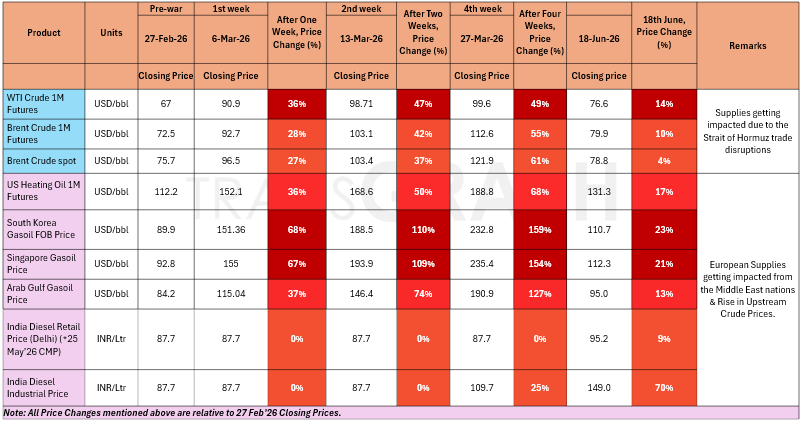
- Asia's seaborne crude oil imports edged up to 20.71 MBpd in the Strait of Hormuz continued to limit Middle East oil shipments. Despite crude prices returning near pre-conflict levels, uncertainty persists over shipping security, China's reduced imports, and whether crude flows through the strait can recover enough to meet future demand.
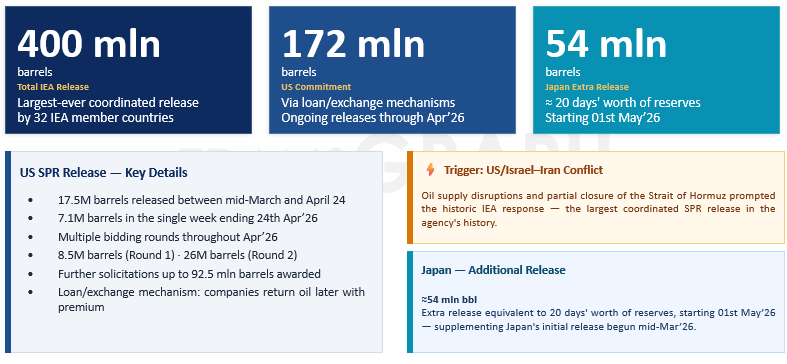
- The US Strategic Petroleum Reserve (SPR) stocks fell by 5.5 mln bbl to 325 mln bbl, their lowest level since May 1983, as part of a planned 172 mln bbl release to offset global supply disruptions following the Iran war. Overall US crude inventories, including commercial and SPR stocks, have dropped by 111 mln bbl to 743 mln bbl since late Feb'26.
- The US launched strikes on Iranian military sites after blaming Iran for a drone attack on a cargo ship in the Strait of Hormuz, while Iran claimed the US violated a recent ceasefire and said it retaliated by targeting US military positions in the region.
- Despite the renewed tensions, Israel and Lebanon signed an agreement aimed at ending fighting with Hezbollah, while oil exports through the Strait of Hormuz resumed and global oil prices fell as shipping activity recovered.
- Despite two earthquakes that killed nearly 1,000 people, Venezuela maintained crude production at 1.2 MBpd, though widespread power outages disrupted operations at the 0.15 MBpd El Palito refinery, ports, petrochemical plants, and key infrastructure.
- Market grapevine indicates that storage tanks across the Gulf are around 50% to 60% full, so if tanker traffic through the strait does not pick up in the near term, producers will need to throttle back output, and the full recovery moves into next year.
- Saudi Aramco resumed oil loading at its Ras Tanura terminal on 26th Jun'26 after a near four-month halt, signaling Middle Eastern producers' efforts to boost exports despite a ship attack in the Strait of Hormuz.
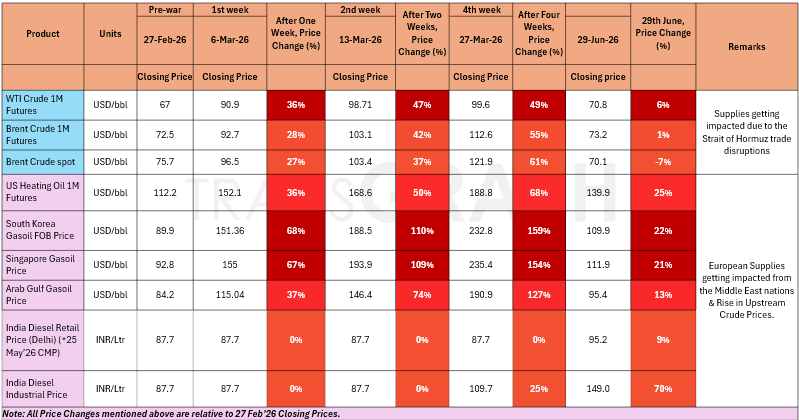
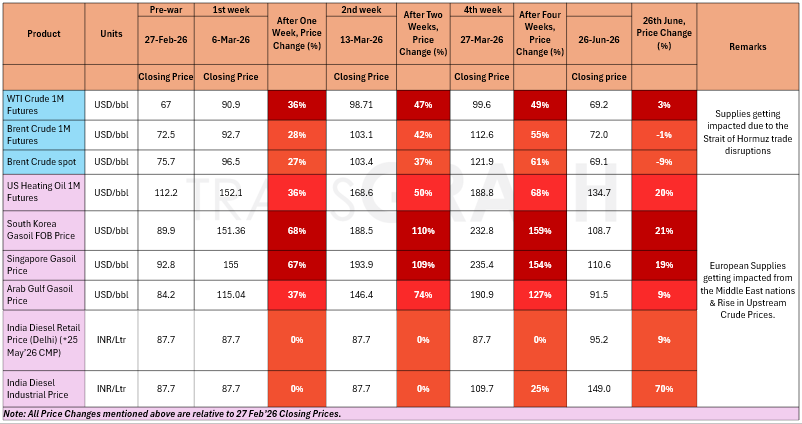
War Impact on Crude Oil & Gasoil/Diesel Prices
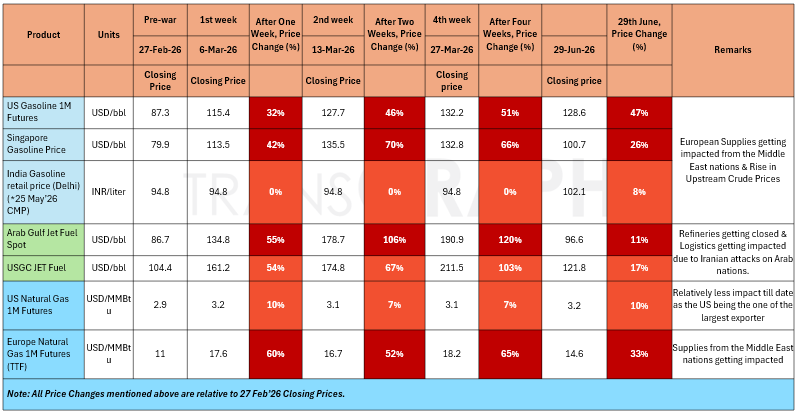
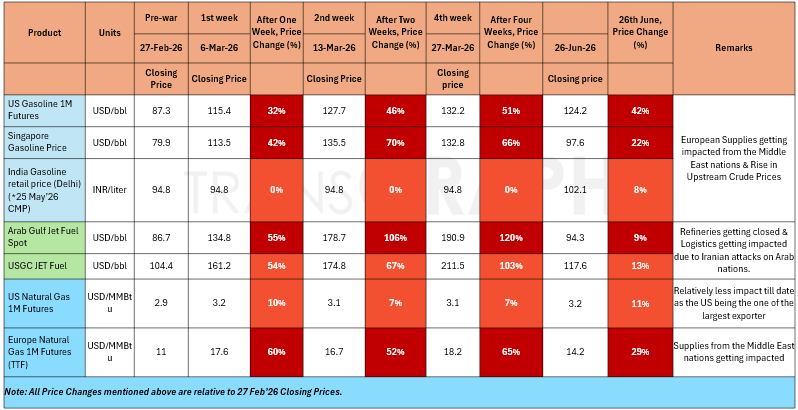
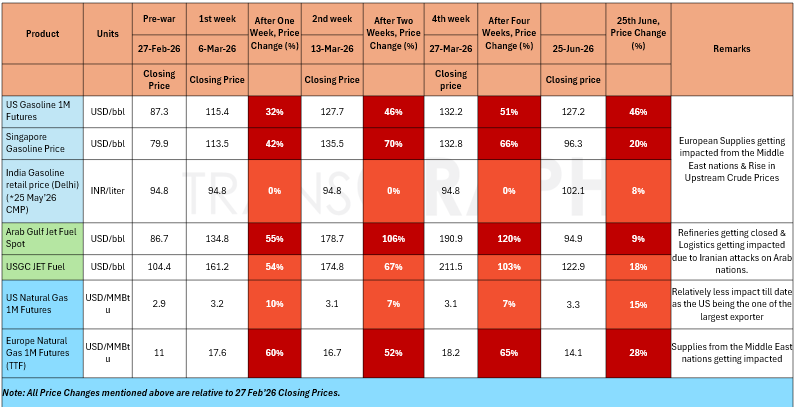
War Impact on Gasoline, ATF & Natural Gas Prices

GCC Bypass Pipelines Running Near Capacity — But Shah Gas Field Ablaze and Fujairah Zone Struck

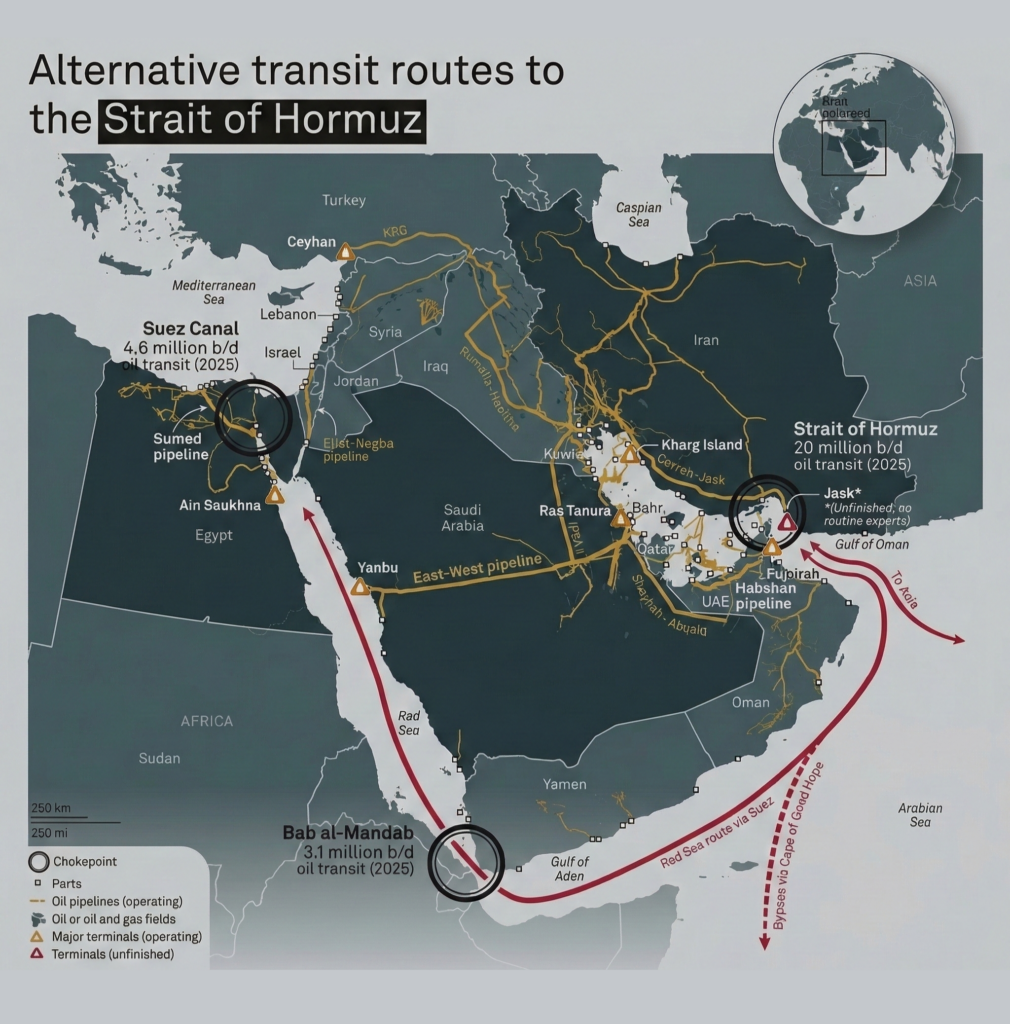
- Saudi Arabia's East-West pipeline is pumping oil at its full capacity of 7 MBpd, bypassing the Strait of Hormuz. Crude oil exports from Yanbu port have reached 5 MBpd, and the country is also exporting 0.70 to 0.90 MBpd of oil products.
- Of approximately 15 MBpd of crude transiting the Strait of Hormuz in OND'25, combined SPR releases and bypass pipeline capacity can offset roughly two-thirds — or slightly more — for the next 20 to 30 days, providing the Trump administration a window to assess strategic direction.
- New strikes directly threaten this buffer — Iranian drones struck the UAE's Shah gas field (currently ablaze) and the Fujairah Oil Industry Zone on Mar 17. A tanker was also hit near the Strait of Hormuz. Saudi Arabia intercepted over a dozen drones; Kuwait and Bahrain sustained additional attacks. These represent the first direct strikes on GCC energy export infrastructure since the conflict began.
War Scenarios Point to Global Supply Deficit of 0.92–1.07 MBpd in 2026 and AMJ Quarter Most Severe with a deficit of 4.10 MBpd.
Pre-war, global supply and demand were near-balanced with a modest surplus of +0.55 MBpd projected for 2026. Both conflict scenarios introduce significant supply deficits driven by Strait of Hormuz disruptions and impacts on Iraq and Kuwait crude production.
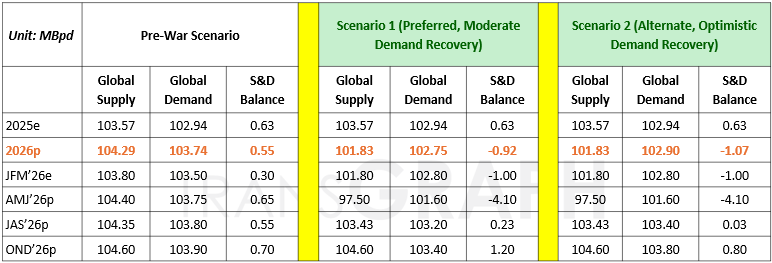
- Scenario 1 (Preferred): Ceasefire talks continue to progress positively, with tanker flows through the Strait of Hormuz gradually normalizing over the next 4–5 weeks. Supply recovers steadily, while demand improves at a slower pace and remains below pre-war expectations, resulting in a moderate market surplus.
- Scenario 2 (Alternate): The Strait of Hormuz normalizes over the next 4–5 weeks, supporting a gradual recovery in oil exports and supply. Demand rebounds more strongly than in Scenario 1, reducing the market surplus, although overall consumption remains below pre-war levels.
Geopolitical backdrop:

The United States and Iran concluded their first round of high-level talks in Switzerland, agreeing on a roadmap to reach a final deal within 60 days, while technical negotiations will continue this week. The discussions took place amid renewed tensions over Iran's closure of the Strait of Hormuz and U.S. warnings of potential military action. According to a joint statement released by Qatar and Pakistan, the parties also agreed to establish mechanisms aimed at ensuring safe commercial navigation through the Strait of Hormuz and advancing efforts to end hostilities in Lebanon. Iranian Foreign Minister Abbas Araqchi stated that the discussions resulted in waivers for certain Iranian oil and petrochemical exports, the release of a portion of the country's frozen assets, and the initiation of a reconstruction and development framework for Iran. Despite ongoing uncertainties, the diplomatic progress is likely to ease immediate concerns over global energy supply disruptions and geopolitical risks.
While the Fed has kept interest rates unchanged, updated projections indicated an increased likelihood of a rate hike later this year, with Chair Kevin Warsh reaffirming the central bank's commitment to containing inflation. Higher Treasury yields and firm U.S. economic data continue to support the dollar.
Steel:
- Domestic steel prices have moderated from recent highs.
- Steel supply chains remain largely insulated from the Middle East conflict.
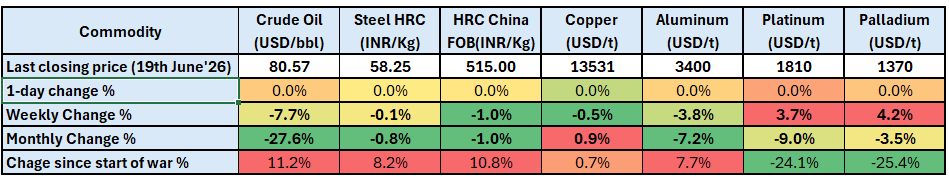
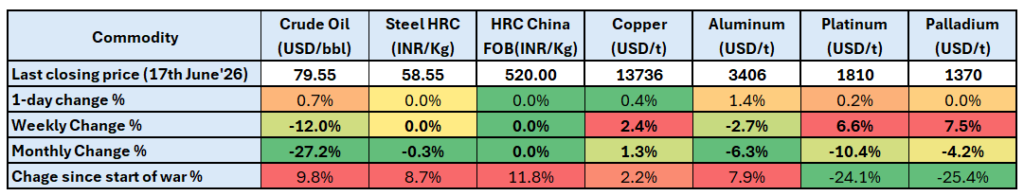
- Since, the start of war steel HRC prices are up by 8.7%.
Base metals:
- Copper ended last week down by 0.5%, primarily due to FOMC outcome and expectations of rate cuts towards the end of the year.
- Aluminum rose by 7.7% since start of war linked to Gulf region supply disruptions. However, demand softness, possible peace deal, and macroeconomic sentiments are now driving price action.
Precious metals:
- Volatility has eased, but prices face upward pressure, due to improving market sentiment in peace talks.
- However, any esclation and halt in a resolution will pressure on Precious Metals.
- Stronger U.S. yields and weak industrial offtake—especially auto—are suppressing any upside momentum.
LPG Market Update
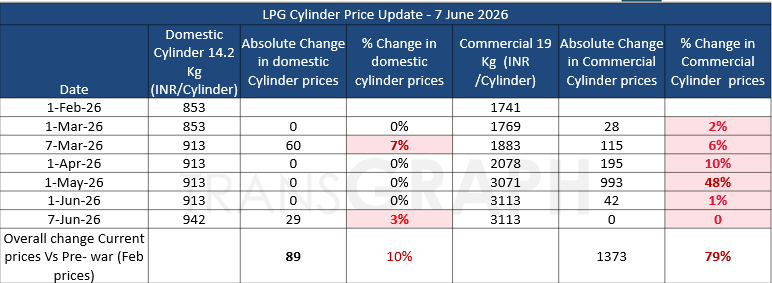
- India’s LPG market saw another upward revision on 1st June 2026 , with oil marketing companies increasing commercial cylinder prices. Commercial LPG prices were raised across major cities, with the 19 kg cylinder in Delhi increasing by Rs 42 to Rs 3,113.50. Similar hikes were reported nationwide, ranging from Rs 42 to Rs 53.50 per cylinder.
India’s domestic LPG market witnessed a price revision on 7 June 2026, with Oil Marketing Companies (OMCs) increasing the price of the 14.2 kg domestic LPG cylinder by ₹29 per cylinder across the country. - In addition to commercial cylinders, oil marketing companies also increased the price of 5 kg Free Trade LPG (FTL) cylinders by Rs 11. Following the revision, the retail price of a 5 kg FTL cylinder in Delhi now stands at Rs 821.50. FTL cylinders are sold outside the subsidized domestic LPG system and are commonly used by migrant workers, temporary households, street vendors, and consumers requiring smaller LPG packs.
Impact Assessment of US/Israel-Iran Conflict
- The US launched strikes on Iranian military sites after blaming Iran for a drone attack on a cargo ship in the Strait of Hormuz, while Iran claimed the US violated a recent ceasefire and said it retaliated by targeting US military positions in the region.
- Despite the renewed tensions, Israel and Lebanon signed an agreement aimed at ending fighting with Hezbollah, while oil exports through the Strait of Hormuz resumed and global oil prices fell as shipping activity recovered.
- Despite two earthquakes that killed nearly 1,000 people, Venezuela maintained crude production at 1.2 MBpd, though widespread power outages disrupted operations at the 0.15 MBpd El Palito refinery, ports, petrochemical plants, and key infrastructure.
- Market grapevine indicates that storage tanks across the Gulf are around 50% to 60% full, so if tanker traffic through the strait does not pick up in the near term, producers will need to throttle back output, and the full recovery moves into next year.
- Saudi Aramco resumed oil loading at its Ras Tanura terminal on 26th Jun'26 after a near four-month halt, signaling Middle Eastern producers' efforts to boost exports despite a ship attack in the Strait of Hormuz.
- The terminal, the world's largest oil port, saw two Very Large Crude Carriers controlled by Saudi's shipping arm Bahri loading crude, each capable of loading 2 mln bbl of oil.
- The US oil and gas rig counts posted their biggest weekly increase since Jun'22, rising by 10 to 573, as producers boosted drilling amid expectations of higher oil prices, with the EIA forecasting crude output to reach 13.7 MBpd and gas production 111.0 bcfd in 2026.
War Impact on Crude Oil & Gasoil/Diesel Prices
War Impact on Gasoline, ATF & Natural Gas Prices
GCC Bypass Pipelines Running Near Capacity — But Shah Gas Field Ablaze and Fujairah Zone Struck
- Saudi Arabia's East-West pipeline is pumping oil at its full capacity of 7 MBpd, bypassing the Strait of Hormuz. Crude oil exports from Yanbu port have reached 5 MBpd, and the country is also exporting 0.70 to 0.90 MBpd of oil products.
- Of approximately 15 MBpd of crude transiting the Strait of Hormuz in OND'25, combined SPR releases and bypass pipeline capacity can offset roughly two-thirds — or slightly more — for the next 20 to 30 days, providing the Trump administration a window to assess strategic direction.
- New strikes directly threaten this buffer — Iranian drones struck the UAE's Shah gas field (currently ablaze) and the Fujairah Oil Industry Zone on Mar 17. A tanker was also hit near the Strait of Hormuz. Saudi Arabia intercepted over a dozen drones; Kuwait and Bahrain sustained additional attacks. These represent the first direct strikes on GCC energy export infrastructure since the conflict began.
War Scenarios Point to Global Supply Deficit of 0.92–1.07 MBpd in 2026 and AMJ Quarter Most Severe with a deficit of 4.10 MBpd.
Pre-war, global supply and demand were near-balanced with a modest surplus of +0.55 MBpd projected for 2026. Both conflict scenarios introduce significant supply deficits driven by Strait of Hormuz disruptions and impacts on Iraq and Kuwait crude production.
- Scenario 1 (Preferred): Ceasefire talks continue to progress positively, with tanker flows through the Strait of Hormuz gradually normalizing over the next 4–5 weeks. Supply recovers steadily, while demand improves at a slower pace and remains below pre-war expectations, resulting in a moderate market surplus.
- Scenario 2 (Alternate): The Strait of Hormuz normalizes over the next 4–5 weeks, supporting a gradual recovery in oil exports and supply. Demand rebounds more strongly than in Scenario 1, reducing the market surplus, although overall consumption remains below pre-war levels.
Geopolitical backdrop:
The United States and Iran concluded their first round of high-level talks in Switzerland, agreeing on a roadmap to reach a final deal within 60 days, while technical negotiations will continue this week. The discussions took place amid renewed tensions over Iran's closure of the Strait of Hormuz and U.S. warnings of potential military action. According to a joint statement released by Qatar and Pakistan, the parties also agreed to establish mechanisms aimed at ensuring safe commercial navigation through the Strait of Hormuz and advancing efforts to end hostilities in Lebanon. Iranian Foreign Minister Abbas Araqchi stated that the discussions resulted in waivers for certain Iranian oil and petrochemical exports, the release of a portion of the country's frozen assets, and the initiation of a reconstruction and development framework for Iran. Despite ongoing uncertainties, the diplomatic progress is likely to ease immediate concerns over global energy supply disruptions and geopolitical risks.
While the Fed has kept interest rates unchanged, updated projections indicated an increased likelihood of a rate hike later this year, with Chair Kevin Warsh reaffirming the central bank's commitment to containing inflation. Higher Treasury yields and firm U.S. economic data continue to support the dollar.
Steel:
- Domestic steel prices have moderated from recent highs.
- Steel supply chains remain largely insulated from the Middle East conflict.
- Since, the start of war steel HRC prices are up by 8.7%.
Base metals:
- Copper ended last week down by 0.5%, primarily due to FOMC outcome and expectations of rate cuts towards the end of the year.
- Aluminum rose by 7.7% since start of war linked to Gulf region supply disruptions. However, demand softness, possible peace deal, and macroeconomic sentiments are now driving price action.
Precious metals:
- Volatility has eased, but prices face upward pressure, due to improving market sentiment in peace talks.
- However, any esclation and halt in a resolution will pressure on Precious Metals.
- Stronger U.S. yields and weak industrial offtake—especially auto—are suppressing any upside momentum.
LPG Market Update
- India’s LPG market saw another upward revision on 1st June 2026 , with oil marketing companies increasing commercial cylinder prices. Commercial LPG prices were raised across major cities, with the 19 kg cylinder in Delhi increasing by Rs 42 to Rs 3,113.50. Similar hikes were reported nationwide, ranging from Rs 42 to Rs 53.50 per cylinder.
India’s domestic LPG market witnessed a price revision on 7 June 2026, with Oil Marketing Companies (OMCs) increasing the price of the 14.2 kg domestic LPG cylinder by ₹29 per cylinder across the country. - In addition to commercial cylinders, oil marketing companies also increased the price of 5 kg Free Trade LPG (FTL) cylinders by Rs 11. Following the revision, the retail price of a 5 kg FTL cylinder in Delhi now stands at Rs 821.50. FTL cylinders are sold outside the subsidized domestic LPG system and are commonly used by migrant workers, temporary households, street vendors, and consumers requiring smaller LPG packs.
Impact Assessment of US/Israel-Iran Conflict
- The UN International Maritime Organization (IMO) paused its operation to escort ships through the Strait of Hormuz on Thursday after a vessel reported an attack, reigniting concerns about whether a preliminary deal to end the Iran war will hold.
- Iran's Revolutionary Guards said safe passage through the strait would only be possible through routes designated by Iran, adding that it would take action against vessels that failed to comply.
- Market grapevine indicates that storage tanks across the Gulf are around 50% to 60% full, so if tanker traffic through the strait does not pick up in the near term, producers will need to throttle back output, and the full recovery moves into next year.
- Saudi Aramco resumed oil loading at its Ras Tanura terminal on 26th Jun'26 after a near four-month halt, signaling Middle Eastern producers' efforts to boost exports despite a ship attack in the Strait of Hormuz.
- The terminal, the world's largest oil port, saw two Very Large Crude Carriers controlled by Saudi's shipping arm Bahri loading crude, each capable of loading 2 mln bbl of oil.
- QatarEnergy has issued a tender to sell crude for July-to-August loading, likely its first since the US-Iran conflict began, according to trade sources. The producer is offering its al-Shaheen, Marine Qatar and Marine Land crude, with buyers able to load or lift via ship-to-ship transfer between Fujairah and Sohar.
- China's state-owned refiners, including PetroChina and Sinopec, are considering resuming Iranian oil purchases, but their interest is tempered by competing alternative supplies and falling domestic fuel demand.
- The US Energy Department announced that energy firm Vitol took a loan of 0.50 mln bbl of crude oil from the Strategic Petroleum Reserve, representing about 1.25% of the quantities available in the latest allotment.
- The Trump administration agreed to release 172 mln bbl from the SPR in a coordinated effort with the International Energy Agency to control fuel prices. Companies borrowing the oil are required to return the original volumes with premiums of up to 24% in the form of extra oil, helping stabilize markets at no cost to US taxpayers.
- Oil tanker operators are earning record profits as they nearly double the hire cost of vessels going through the Strait of Hormuz and wider Gulf region due to rising demand and a shortage of available vessels.
War Impact on Crude Oil & Gasoil/Diesel Prices

War Impact on Gasoline, ATF & Natural Gas Prices
GCC Bypass Pipelines Running Near Capacity — But Shah Gas Field Ablaze and Fujairah Zone Struck
- Saudi Arabia's East-West pipeline is pumping oil at its full capacity of 7 MBpd, bypassing the Strait of Hormuz. Crude oil exports from Yanbu port have reached 5 MBpd, and the country is also exporting 0.70 to 0.90 MBpd of oil products.
- Of approximately 15 MBpd of crude transiting the Strait of Hormuz in OND'25, combined SPR releases and bypass pipeline capacity can offset roughly two-thirds — or slightly more — for the next 20 to 30 days, providing the Trump administration a window to assess strategic direction.
- New strikes directly threaten this buffer — Iranian drones struck the UAE's Shah gas field (currently ablaze) and the Fujairah Oil Industry Zone on Mar 17. A tanker was also hit near the Strait of Hormuz. Saudi Arabia intercepted over a dozen drones; Kuwait and Bahrain sustained additional attacks. These represent the first direct strikes on GCC energy export infrastructure since the conflict began.
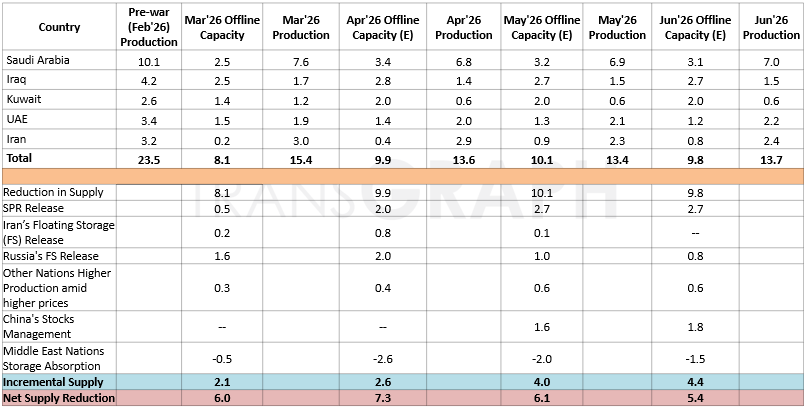
Supply & Demand Analysis
War Scenarios Point to Global Supply Deficit of 1.35–1.90 MBpd in 2026 and AMJ Quarter Most Severe with a deficit of 3.00 - 4.50 MBpd.
Pre-war, global supply and demand were near-balanced with a modest surplus of +0.55 MBpd projected for 2026. Both conflict scenarios introduce significant supply deficits driven by Strait of Hormuz disruptions and impacts on Iraq and Kuwait crude production.
- Scenario 1 (Preferred): Ceasefire talks to remain on a progressive note and flows through the Strait of Hormuz improving over the coming weeks; however crude oil production losses will be there due to further non-availability of storage on on-shore in Iraq, Kuwait and other small Middle East nations.
- Scenario 2 (Alternate): No major deal being achieved from ceasefire talks and post completion of ceasefire talks, tensions continuing to remain in the Middle East and flows through the Strait of Hormuz continuing to remain restrained. Crude Oil Production Facilities & Refining Centers in the Middle East region getting affected and trade disruptions in Strait of Hormuz will be there for medium to long term (4 to 7 months).
Brent Crude 1M Futures are expected to trade in a range of 100 USD/bbl to 125 USD/bbl over the coming 1 to 2 weeks. The coordinated SPR release and GCC bypass capacity provide a meaningful supply cushion that limits sustained upside beyond these levels.
Metals & Energy Market Update – Geopolitical Context (Iran Conflict)
Geopolitical backdrop:
The United States and Iran concluded their first round of high-level talks in Switzerland, agreeing on a roadmap to reach a final deal within 60 days, while technical negotiations will continue this week. The discussions took place amid renewed tensions over Iran's closure of the Strait of Hormuz and U.S. warnings of potential military action. According to a joint statement released by Qatar and Pakistan, the parties also agreed to establish mechanisms aimed at ensuring safe commercial navigation through the Strait of Hormuz and advancing efforts to end hostilities in Lebanon. Iranian Foreign Minister Abbas Araqchi stated that the discussions resulted in waivers for certain Iranian oil and petrochemical exports, the release of a portion of the country's frozen assets, and the initiation of a reconstruction and development framework for Iran. Despite ongoing uncertainties, the diplomatic progress is likely to ease immediate concerns over global energy supply disruptions and geopolitical risks.
While the Fed has kept interest rates unchanged, updated projections indicated an increased likelihood of a rate hike later this year, with Chair Kevin Warsh reaffirming the central bank's commitment to containing inflation. Higher Treasury yields and firm U.S. economic data continue to support the dollar.
Steel:
- Domestic steel prices have moderated from recent highs.
- Steel supply chains remain largely insulated from the Middle East conflict.
- Since, the start of war steel HRC prices are up by 8.7%.
Base metals:
- Copper ended last week down by 0.5%, primarily due to FOMC outcome and expectations of rate cuts towards the end of the year.
- Aluminum rose by 7.7% since start of war linked to Gulf region supply disruptions. However, demand softness, possible peace deal, and macroeconomic sentiments are now driving price action.
Precious metals:
- Volatility has eased, but prices face upward pressure, due to improving market sentiment in peace talks.
- However, any esclation and halt in a resolution will pressure on Precious Metals.
- Stronger U.S. yields and weak industrial offtake—especially auto—are suppressing any upside momentum.
LPG Market Update
- India’s LPG market saw another upward revision on 1st June 2026 , with oil marketing companies increasing commercial cylinder prices. Commercial LPG prices were raised across major cities, with the 19 kg cylinder in Delhi increasing by Rs 42 to Rs 3,113.50. Similar hikes were reported nationwide, ranging from Rs 42 to Rs 53.50 per cylinder.
India’s domestic LPG market witnessed a price revision on 7 June 2026, with Oil Marketing Companies (OMCs) increasing the price of the 14.2 kg domestic LPG cylinder by ₹29 per cylinder across the country. - In addition to commercial cylinders, oil marketing companies also increased the price of 5 kg Free Trade LPG (FTL) cylinders by Rs 11. Following the revision, the retail price of a 5 kg FTL cylinder in Delhi now stands at Rs 821.50. FTL cylinders are sold outside the subsidized domestic LPG system and are commonly used by migrant workers, temporary households, street vendors, and consumers requiring smaller LPG packs.
Impact Assessment of US/Israel-Iran Conflict
- The US Energy Department announced that energy firm Vitol took a loan of 0.50 mln bbl of crude oil from the Strategic Petroleum Reserve, representing about 1.25% of the quantities available in the latest allotment.
- The Trump administration agreed to release 172 mln bbl from the SPR in a coordinated effort with the International Energy Agency to control fuel prices. Companies borrowing the oil are required to return the original volumes with premiums of up to 24% in the form of extra oil, helping stabilize markets at no cost to US taxpayers.
- Oil tanker operators are earning record profits as they nearly double the hire cost of vessels going through the Strait of Hormuz and wider Gulf region due to rising demand and a shortage of available vessels.
- Traffic through the vital strait has been modest since Iran lifted its effective blockade last week, as many as 100 tankers remain stuck inside the Gulf, and Middle Eastern crude producers are ramping up exports.
- Two crude tankers carrying nearly 2 mln barrels of oil sailed through the Strait of Hormuz on 22nd Jun'26, indicating a rise in traffic following weaker flows on Sunday due to passage concerns.
- The US authorised Iranian oil sales on 22nd Jun'26, easing decades-old sanctions as it pushes toward a final peace deal with Tehran. The general license allows the sale of Iranian crude oil and petrochemical and petroleum products through 21st Aug'26, and permits import into the US when necessary to complete their sale, delivery or offloading.
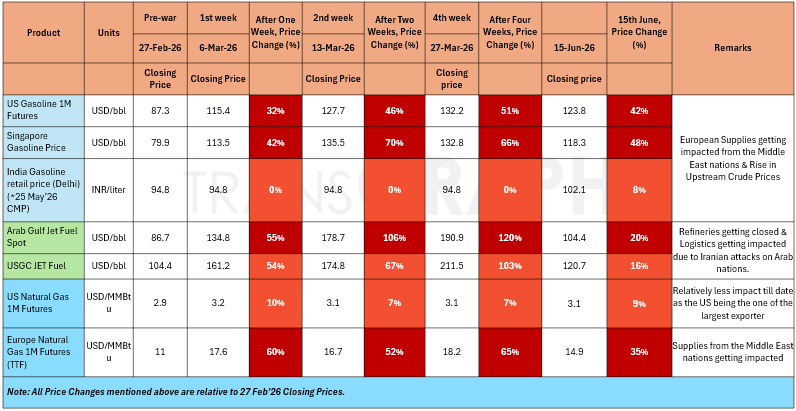
- European gasoline exports to the US have weakened sharply, with May'26 shipments averaging 1.63 MBpd versus 1.9 MBpd a year earlier, while second-quarter exports are expected to average just 0.25 MBpd, the lowest seasonal level since 2020, as refinery closures, rising European demand, and disruptions linked to the Iran war tighten supplies.
- The global gasoline market is projected to face deficits of 1.0 MBpd in May'26 and 1.13 MBpd in Jun'26, while US gasoline inventories have fallen to 215 mln bbl, their lowest Jun'26 level since 2014, raising concerns about fuel availability during the peak summer driving season.
War Impact on Crude Oil & Gasoil/Diesel Prices

War Impact on Gasoline, ATF & Natural Gas Prices

GCC Bypass Pipelines Running Near Capacity — But Shah Gas Field Ablaze and Fujairah Zone Struck
- Saudi Arabia's East-West pipeline is pumping oil at its full capacity of 7 MBpd, bypassing the Strait of Hormuz. Crude oil exports from Yanbu port have reached 5 MBpd, and the country is also exporting 0.70 to 0.90 MBpd of oil products.
- Of approximately 15 MBpd of crude transiting the Strait of Hormuz in OND'25, combined SPR releases and bypass pipeline capacity can offset roughly two-thirds — or slightly more — for the next 20 to 30 days, providing the Trump administration a window to assess strategic direction.
- New strikes directly threaten this buffer — Iranian drones struck the UAE's Shah gas field (currently ablaze) and the Fujairah Oil Industry Zone on Mar 17. A tanker was also hit near the Strait of Hormuz. Saudi Arabia intercepted over a dozen drones; Kuwait and Bahrain sustained additional attacks. These represent the first direct strikes on GCC energy export infrastructure since the conflict began.
Supply & Demand Analysis
War Scenarios Point to Global Supply Deficit of 1.35–1.90 MBpd in 2026 and AMJ Quarter Most Severe with a deficit of 3.00 - 4.50 MBpd.
Pre-war, global supply and demand were near-balanced with a modest surplus of +0.55 MBpd projected for 2026. Both conflict scenarios introduce significant supply deficits driven by Strait of Hormuz disruptions and impacts on Iraq and Kuwait crude production.
- Scenario 1 (Preferred): Ceasefire talks to remain on a progressive note and flows through the Strait of Hormuz improving over the coming weeks; however crude oil production losses will be there due to further non-availability of storage on on-shore in Iraq, Kuwait and other small Middle East nations.
- Scenario 2 (Alternate): No major deal being achieved from ceasefire talks and post completion of ceasefire talks, tensions continuing to remain in the Middle East and flows through the Strait of Hormuz continuing to remain restrained. Crude Oil Production Facilities & Refining Centers in the Middle East region getting affected and trade disruptions in Strait of Hormuz will be there for medium to long term (4 to 7 months).
Brent Crude 1M Futures are expected to trade in a range of 100 USD/bbl to 125 USD/bbl over the coming 1 to 2 weeks. The coordinated SPR release and GCC bypass capacity provide a meaningful supply cushion that limits sustained upside beyond these levels.
Metals & Energy Market Update – Geopolitical Context (Iran Conflict)
Geopolitical backdrop:
The United States and Iran concluded their first round of high-level talks in Switzerland, agreeing on a roadmap to reach a final deal within 60 days, while technical negotiations will continue this week. The discussions took place amid renewed tensions over Iran's closure of the Strait of Hormuz and U.S. warnings of potential military action. According to a joint statement released by Qatar and Pakistan, the parties also agreed to establish mechanisms aimed at ensuring safe commercial navigation through the Strait of Hormuz and advancing efforts to end hostilities in Lebanon. Iranian Foreign Minister Abbas Araqchi stated that the discussions resulted in waivers for certain Iranian oil and petrochemical exports, the release of a portion of the country's frozen assets, and the initiation of a reconstruction and development framework for Iran. Despite ongoing uncertainties, the diplomatic progress is likely to ease immediate concerns over global energy supply disruptions and geopolitical risks.
While the Fed has kept interest rates unchanged, updated projections indicated an increased likelihood of a rate hike later this year, with Chair Kevin Warsh reaffirming the central bank's commitment to containing inflation. Higher Treasury yields and firm U.S. economic data continue to support the dollar.
Steel:
- Domestic steel prices have moderated from recent highs.
- Steel supply chains remain largely insulated from the Middle East conflict.
- Since, the start of war steel HRC prices are up by 8.7%.
Base metals:
- Copper ended last week down by 0.5%, primarily due to FOMC outcome and expectations of rate cuts towards the end of the year.
- Aluminum rose by 7.7% since start of war linked to Gulf region supply disruptions. However, demand softness, possible peace deal, and macroeconomic sentiments are now driving price action.
Precious metals:
- Volatility has eased, but prices face upward pressure, due to improving market sentiment in peace talks.
- However, any esclation and halt in a resolution will pressure on Precious Metals.
- Stronger U.S. yields and weak industrial offtake—especially auto—are suppressing any upside momentum.
LPG Market Update
- India’s LPG market saw another upward revision on 1st June 2026 , with oil marketing companies increasing commercial cylinder prices. Commercial LPG prices were raised across major cities, with the 19 kg cylinder in Delhi increasing by Rs 42 to Rs 3,113.50. Similar hikes were reported nationwide, ranging from Rs 42 to Rs 53.50 per cylinder.
India’s domestic LPG market witnessed a price revision on 7 June 2026, with Oil Marketing Companies (OMCs) increasing the price of the 14.2 kg domestic LPG cylinder by ₹29 per cylinder across the country. - In addition to commercial cylinders, oil marketing companies also increased the price of 5 kg Free Trade LPG (FTL) cylinders by Rs 11. Following the revision, the retail price of a 5 kg FTL cylinder in Delhi now stands at Rs 821.50. FTL cylinders are sold outside the subsidized domestic LPG system and are commonly used by migrant workers, temporary households, street vendors, and consumers requiring smaller LPG packs.
Impact Assessment of US/Israel-Iran Conflict
- Two crude tankers carrying nearly 2 million barrels of oil sailed through the Strait of Hormuz on 22nd Jun'26, indicating a rise in traffic following weaker flows on Sunday due to passage concerns.
- The US authorised Iranian oil sales on Monday, easing decades-old sanctions as it pushes toward a final peace deal with Tehran. The general license allows the sale of Iranian crude oil and petrochemical and petroleum products through 21st Aug'26, and permits import into the US when necessary to complete their sale, delivery or offloading.
- Iran has committed to free and open transit in the Strait of Hormuz and to permit International Atomic Energy Agency inspectors into their country, in line with ongoing productive talks in Switzerland.
- The Strait of Hormuz saw a sharp drop in the number of ships passing through on Sunday after Iran announced it had closed the waterway again, citing Israeli and US violations of the interim peace deal. Shipping data showed five vessels passed the strait on 21st Jun'26 (Sunday), down from 26 the previous day.
- Iraq is preparing to export crude oil and naphtha through ports in Syria, after the Iran war cut off its main Gulf shipping routes. The move would continue even after the Iran war ends, as part of a government-approved strategy to reduce Iraq's reliance on a single export corridor.
- Syria plans to open two extra unloading areas and other facilities in Baniyas within a week to handle Iraqi crude oil and naphtha, and Iraqi fuel oil shipped via Syria had reached destinations across Africa and Europe.
- The US-Iran ceasefire resurfaced following US Vice President JD Vance's warning against further Israeli action in Lebanon, although expectations of a gradual restoration of oil flows through the Strait of Hormuz under the interim US-Iran agreement continued to support a broadly balanced market outlook.
- European gasoline exports to the US have weakened sharply, with May'26 shipments averaging 1.63 MBpd versus 1.9 MBpd a year earlier, while second-quarter exports are expected to average just 0.25 MBpd, the lowest seasonal level since 2020, as refinery closures, rising European demand, and disruptions linked to the Iran war tighten supplies.
- The global gasoline market is projected to face deficits of 1.0 MBpd in May'26 and 1.13 MBpd in Jun'26, while US gasoline inventories have fallen to 215 mln bbl, their lowest Jun'26 level since 2014, raising concerns about fuel availability during the peak summer driving season.
War Impact on Crude Oil & Gasoil/Diesel Prices

War Impact on Gasoline, ATF & Natural Gas Prices

GCC Bypass Pipelines Running Near Capacity — But Shah Gas Field Ablaze and Fujairah Zone Struck
- Saudi Arabia's East-West pipeline is pumping oil at its full capacity of 7 MBpd, bypassing the Strait of Hormuz. Crude oil exports from Yanbu port have reached 5 MBpd, and the country is also exporting 0.70 to 0.90 MBpd of oil products.
- Of approximately 15 MBpd of crude transiting the Strait of Hormuz in OND'25, combined SPR releases and bypass pipeline capacity can offset roughly two-thirds — or slightly more — for the next 20 to 30 days, providing the Trump administration a window to assess strategic direction.
- New strikes directly threaten this buffer — Iranian drones struck the UAE's Shah gas field (currently ablaze) and the Fujairah Oil Industry Zone on Mar 17. A tanker was also hit near the Strait of Hormuz. Saudi Arabia intercepted over a dozen drones; Kuwait and Bahrain sustained additional attacks. These represent the first direct strikes on GCC energy export infrastructure since the conflict began.
Supply & Demand Analysis
War Scenarios Point to Global Supply Deficit of 1.35–1.90 MBpd in 2026 and AMJ Quarter Most Severe with a deficit of 3.00 - 4.50 MBpd.
Pre-war, global supply and demand were near-balanced with a modest surplus of +0.55 MBpd projected for 2026. Both conflict scenarios introduce significant supply deficits driven by Strait of Hormuz disruptions and impacts on Iraq and Kuwait crude production.
- Scenario 1 (Preferred): Ceasefire talks to remain on a progressive note and flows through the Strait of Hormuz improving over the coming weeks; however crude oil production losses will be there due to further non-availability of storage on on-shore in Iraq, Kuwait and other small Middle East nations.
- Scenario 2 (Alternate): No major deal being achieved from ceasefire talks and post completion of ceasefire talks, tensions continuing to remain in the Middle East and flows through the Strait of Hormuz continuing to remain restrained. Crude Oil Production Facilities & Refining Centers in the Middle East region getting affected and trade disruptions in Strait of Hormuz will be there for medium to long term (4 to 7 months).
Brent Crude 1M Futures are expected to trade in a range of 100 USD/bbl to 125 USD/bbl over the coming 1 to 2 weeks. The coordinated SPR release and GCC bypass capacity provide a meaningful supply cushion that limits sustained upside beyond these levels.
Metals & Energy Market Update – Geopolitical Context (Iran Conflict)
Geopolitical backdrop:
The United States and Iran concluded their first round of high-level talks in Switzerland, agreeing on a roadmap to reach a final deal within 60 days, while technical negotiations will continue this week. The discussions took place amid renewed tensions over Iran's closure of the Strait of Hormuz and U.S. warnings of potential military action. According to a joint statement released by Qatar and Pakistan, the parties also agreed to establish mechanisms aimed at ensuring safe commercial navigation through the Strait of Hormuz and advancing efforts to end hostilities in Lebanon. Iranian Foreign Minister Abbas Araqchi stated that the discussions resulted in waivers for certain Iranian oil and petrochemical exports, the release of a portion of the country's frozen assets, and the initiation of a reconstruction and development framework for Iran. Despite ongoing uncertainties, the diplomatic progress is likely to ease immediate concerns over global energy supply disruptions and geopolitical risks.
While the Fed has kept interest rates unchanged, updated projections indicated an increased likelihood of a rate hike later this year, with Chair Kevin Warsh reaffirming the central bank's commitment to containing inflation. Higher Treasury yields and firm U.S. economic data continue to support the dollar.
Steel:
- Domestic steel prices have moderated from recent highs.
- Steel supply chains remain largely insulated from the Middle East conflict.
- Since, the start of war steel HRC prices are up by 8.7%.
Base metals:
- Copper ended last week down by 0.5%, primarily due to FOMC outcome and expectations of rate cuts towards the end of the year.
- Aluminum rose by 7.7% since start of war linked to Gulf region supply disruptions. However, demand softness, possible peace deal, and macroeconomic sentiments are now driving price action.
Precious metals:
- Volatility has eased, but prices face upward pressure, due to improving market sentiment in peace talks.
- However, any esclation and halt in a resolution will pressure on Precious Metals.
- Stronger U.S. yields and weak industrial offtake—especially auto—are suppressing any upside momentum.
LPG Market Update

- India’s LPG market saw another upward revision on 1st June 2026 , with oil marketing companies increasing commercial cylinder prices. Commercial LPG prices were raised across major cities, with the 19 kg cylinder in Delhi increasing by Rs 42 to Rs 3,113.50. Similar hikes were reported nationwide, ranging from Rs 42 to Rs 53.50 per cylinder.
India’s domestic LPG market witnessed a price revision on 7 June 2026, with Oil Marketing Companies (OMCs) increasing the price of the 14.2 kg domestic LPG cylinder by ₹29 per cylinder across the country. - In addition to commercial cylinders, oil marketing companies also increased the price of 5 kg Free Trade LPG (FTL) cylinders by Rs 11. Following the revision, the retail price of a 5 kg FTL cylinder in Delhi now stands at Rs 821.50. FTL cylinders are sold outside the subsidized domestic LPG system and are commonly used by migrant workers, temporary households, street vendors, and consumers requiring smaller LPG packs.
Impact Assessment of US/Israel-Iran Conflict
The US and Iran have reached an interim framework agreement aimed at ending immediate hostilities and creating a pathway for broader negotiations. The agreement is not a final comprehensive treaty but rather a temporary arrangement designed to stabilise the situation and provide a 60-day period for diplomatic discussions on unresolved issues. Both sides have confirmed the agreement, with formal signing expected around 19th Jun’26, in Switzerland.
Core Agreed Elements
- The agreement calls for an immediate cessation of military operations and hostile activities on all fronts, including Lebanon. The ceasefire extends the existing truce for an initial period of 60 days and may be extended further through mutual consent. The objective is to prevent further escalation and create conditions conducive to diplomacy.
- The Strait of Hormuz will be reopened to international commercial shipping. Iran has committed to clearing naval mines and restoring safe navigation through the waterway. Both sides aim to return shipping traffic to pre-conflict levels within approximately 30 days. While US officials have described access as toll-free, Iranian authorities maintain that environmental and maritime traffic management fees may still be collected. Iran retains sovereignty and control over the Strait.
- The US will lift its naval blockade of Iranian ports, allowing normal maritime access and facilitating the resumption of international trade and commercial shipping activities involving Iran.
- The agreement does not resolve the most contentious nuclear issues. Instead, these matters will be addressed during the 60-day negotiation period. Iran has reaffirmed its commitment in principle not to pursue nuclear weapons and has agreed to discuss the future of its enriched uranium stockpile. Specific arrangements concerning uranium removal or reduction, enrichment limits, international inspections, and the potential dismantlement of nuclear facilities remain subject to future negotiations.
- The framework provides for limited and temporary sanctions relief, particularly regarding Iranian oil exports. Discussions will also begin regarding the release of certain frozen Iranian assets. Any broader or permanent sanctions relief will be tied to compliance with future agreements and performance benchmarks established during subsequent negotiations.
Production/Supply Recovery
- A tentative US-Iran framework agreement to end the conflict and reopen the Strait of Hormuz has eased immediate concerns over global energy supplies, sending oil prices lower.
- However, industry experts caution that restoring oil and gas production, refining operations, and shipping flows will take considerable time, with some oil output returning within weeks but full recovery potentially requiring months or years.
- More than 14 MBpd of oil production and significant refining and LNG capacity were disrupted during the conflict, while global oil inventories have fallen sharply.
- Market grapevines expect a gradual recovery, ongoing repair costs running into tens of billions of dollars, and a prolonged period of inventory rebuilding as countries seek to strengthen energy security against future geopolitical risks.
- Although the US and Iran have reached a preliminary agreement to reopen the Strait of Hormuz, maritime security experts warn that normal shipping operations may not resume for 40–50 days due to the need to detect and clear potential naval mines.
- Shipping companies, insurers, and oil traders remain cautious, as even a single mine poses a serious threat to vessels carrying cargoes worth hundreds of millions of dollars.
- Traffic through the strait remains far below pre-war levels, and uncertainty over the extent of Iran's mine deployments continues to hinder confidence. While international naval forces have begun preparations for mine-clearing operations, industry officials say restoring full safety and normal shipping volumes could take weeks or even months, prolonging disruptions to global energy supplies and trade.
War Impact on Crude Oil & Gasoil/Diesel Prices

War Impact on Gasoline, ATF & Natural Gas Prices

GCC Bypass Pipelines Running Near Capacity — But Shah Gas Field Ablaze and Fujairah Zone Struck
- Saudi Arabia's East-West pipeline is pumping oil at its full capacity of 7 MBpd, bypassing the Strait of Hormuz. Crude oil exports from Yanbu port have reached 5 MBpd, and the country is also exporting 0.70 to 0.90 MBpd of oil products.
- Of approximately 15 MBpd of crude transiting the Strait of Hormuz in OND'25, combined SPR releases and bypass pipeline capacity can offset roughly two-thirds — or slightly more — for the next 20 to 30 days, providing the Trump administration a window to assess strategic direction.
- New strikes directly threaten this buffer — Iranian drones struck the UAE's Shah gas field (currently ablaze) and the Fujairah Oil Industry Zone on Mar 17. A tanker was also hit near the Strait of Hormuz. Saudi Arabia intercepted over a dozen drones; Kuwait and Bahrain sustained additional attacks. These represent the first direct strikes on GCC energy export infrastructure since the conflict began.
Supply & Demand Analysis
War Scenarios Point to Global Supply Deficit of 1.35–1.90 MBpd in 2026 and AMJ Quarter Most Severe with a deficit of 3.00 - 4.50 MBpd.
Pre-war, global supply and demand were near-balanced with a modest surplus of +0.55 MBpd projected for 2026. Both conflict scenarios introduce significant supply deficits driven by Strait of Hormuz disruptions and impacts on Iraq and Kuwait crude production.
- Scenario 1 (Preferred): Ceasefire talks to remain on a progressive note and flows through the Strait of Hormuz improving over the coming weeks; however crude oil production losses will be there due to further non-availability of storage on on-shore in Iraq, Kuwait and other small Middle East nations.
- Scenario 2 (Alternate): No major deal being achieved from ceasefire talks and post completion of ceasefire talks, tensions continuing to remain in the Middle East and flows through the Strait of Hormuz continuing to remain restrained. Crude Oil Production Facilities & Refining Centers in the Middle East region getting affected and trade disruptions in Strait of Hormuz will be there for medium to long term (4 to 7 months).
Brent Crude 1M Futures are expected to trade in a range of 100 USD/bbl to 125 USD/bbl over the coming 1 to 2 weeks. The coordinated SPR release and GCC bypass capacity provide a meaningful supply cushion that limits sustained upside beyond these levels.
Metals & Energy Market Update – Geopolitical Context (Iran Conflict)
Geopolitical backdrop:
The United States and Iran concluded their first round of high-level talks in Switzerland, agreeing on a roadmap to reach a final deal within 60 days, while technical negotiations will continue this week. The discussions took place amid renewed tensions over Iran's closure of the Strait of Hormuz and U.S. warnings of potential military action. According to a joint statement released by Qatar and Pakistan, the parties also agreed to establish mechanisms aimed at ensuring safe commercial navigation through the Strait of Hormuz and advancing efforts to end hostilities in Lebanon. Iranian Foreign Minister Abbas Araqchi stated that the discussions resulted in waivers for certain Iranian oil and petrochemical exports, the release of a portion of the country's frozen assets, and the initiation of a reconstruction and development framework for Iran. Despite ongoing uncertainties, the diplomatic progress is likely to ease immediate concerns over global energy supply disruptions and geopolitical risks.
While the Fed has kept interest rates unchanged, updated projections indicated an increased likelihood of a rate hike later this year, with Chair Kevin Warsh reaffirming the central bank's commitment to containing inflation. Higher Treasury yields and firm U.S. economic data continue to support the dollar.
Steel:
- Domestic steel prices have moderated from recent highs.
- Steel supply chains remain largely insulated from the Middle East conflict.
- Since, the start of war steel HRC prices are up by 8.7%.
Base metals:
- Copper ended last week down by 0.5%, primarily due to FOMC outcome and expectations of rate cuts towards the end of the year.
- Aluminum rose by 7.7% since start of war linked to Gulf region supply disruptions. However, demand softness, possible peace deal, and macroeconomic sentiments are now driving price action.
Precious metals:
- Volatility has eased, but prices face upward pressure, due to improving market sentiment in peace talks.
- However, any esclation and halt in a resolution will pressure on Precious Metals.
- Stronger U.S. yields and weak industrial offtake—especially auto—are suppressing any upside momentum.
LPG Market Update
- India’s LPG market saw another upward revision on 1st June 2026 , with oil marketing companies increasing commercial cylinder prices. Commercial LPG prices were raised across major cities, with the 19 kg cylinder in Delhi increasing by Rs 42 to Rs 3,113.50. Similar hikes were reported nationwide, ranging from Rs 42 to Rs 53.50 per cylinder.
India’s domestic LPG market witnessed a price revision on 7 June 2026, with Oil Marketing Companies (OMCs) increasing the price of the 14.2 kg domestic LPG cylinder by ₹29 per cylinder across the country. - In addition to commercial cylinders, oil marketing companies also increased the price of 5 kg Free Trade LPG (FTL) cylinders by Rs 11. Following the revision, the retail price of a 5 kg FTL cylinder in Delhi now stands at Rs 821.50. FTL cylinders are sold outside the subsidized domestic LPG system and are commonly used by migrant workers, temporary households, street vendors, and consumers requiring smaller LPG packs.
Impact Assessment of US/Israel-Iran Conflict
The US and Iran have reached an interim framework agreement aimed at ending immediate hostilities and creating a pathway for broader negotiations. The agreement is not a final comprehensive treaty but rather a temporary arrangement designed to stabilise the situation and provide a 60-day period for diplomatic discussions on unresolved issues. Both sides have confirmed the agreement, with formal signing expected around 19th Jun’26, in Switzerland.
Core Agreed Elements
- The agreement calls for an immediate cessation of military operations and hostile activities on all fronts, including Lebanon. The ceasefire extends the existing truce for an initial period of 60 days and may be extended further through mutual consent. The objective is to prevent further escalation and create conditions conducive to diplomacy.
- The Strait of Hormuz will be reopened to international commercial shipping. Iran has committed to clearing naval mines and restoring safe navigation through the waterway. Both sides aim to return shipping traffic to pre-conflict levels within approximately 30 days. While US officials have described access as toll-free, Iranian authorities maintain that environmental and maritime traffic management fees may still be collected. Iran retains sovereignty and control over the Strait.
- The US will lift its naval blockade of Iranian ports, allowing normal maritime access and facilitating the resumption of international trade and commercial shipping activities involving Iran.
- The agreement does not resolve the most contentious nuclear issues. Instead, these matters will be addressed during the 60-day negotiation period. Iran has reaffirmed its commitment in principle not to pursue nuclear weapons and has agreed to discuss the future of its enriched uranium stockpile. Specific arrangements concerning uranium removal or reduction, enrichment limits, international inspections, and the potential dismantlement of nuclear facilities remain subject to future negotiations.
- The framework provides for limited and temporary sanctions relief, particularly regarding Iranian oil exports. Discussions will also begin regarding the release of certain frozen Iranian assets. Any broader or permanent sanctions relief will be tied to compliance with future agreements and performance benchmarks established during subsequent negotiations.
Production/Supply Recovery
- A tentative US-Iran framework agreement to end the conflict and reopen the Strait of Hormuz has eased immediate concerns over global energy supplies, sending oil prices lower.
- However, industry experts caution that restoring oil and gas production, refining operations, and shipping flows will take considerable time, with some oil output returning within weeks but full recovery potentially requiring months or years.
- More than 14 MBpd of oil production and significant refining and LNG capacity were disrupted during the conflict, while global oil inventories have fallen sharply.
- Market grapevines expect a gradual recovery, ongoing repair costs running into tens of billions of dollars, and a prolonged period of inventory rebuilding as countries seek to strengthen energy security against future geopolitical risks.
- Although the US and Iran have reached a preliminary agreement to reopen the Strait of Hormuz, maritime security experts warn that normal shipping operations may not resume for 40–50 days due to the need to detect and clear potential naval mines.
- Shipping companies, insurers, and oil traders remain cautious, as even a single mine poses a serious threat to vessels carrying cargoes worth hundreds of millions of dollars.
- Traffic through the strait remains far below pre-war levels, and uncertainty over the extent of Iran's mine deployments continues to hinder confidence. While international naval forces have begun preparations for mine-clearing operations, industry officials say restoring full safety and normal shipping volumes could take weeks or even months, prolonging disruptions to global energy supplies and trade.
War Impact on Crude Oil & Gasoil/Diesel Prices
War Impact on Gasoline, ATF & Natural Gas Prices

GCC Bypass Pipelines Running Near Capacity — But Shah Gas Field Ablaze and Fujairah Zone Struck
- Saudi Arabia's East-West pipeline is pumping oil at its full capacity of 7 MBpd, bypassing the Strait of Hormuz. Crude oil exports from Yanbu port have reached 5 MBpd, and the country is also exporting 0.70 to 0.90 MBpd of oil products.
- Of approximately 15 MBpd of crude transiting the Strait of Hormuz in OND'25, combined SPR releases and bypass pipeline capacity can offset roughly two-thirds — or slightly more — for the next 20 to 30 days, providing the Trump administration a window to assess strategic direction.
- New strikes directly threaten this buffer — Iranian drones struck the UAE's Shah gas field (currently ablaze) and the Fujairah Oil Industry Zone on Mar 17. A tanker was also hit near the Strait of Hormuz. Saudi Arabia intercepted over a dozen drones; Kuwait and Bahrain sustained additional attacks. These represent the first direct strikes on GCC energy export infrastructure since the conflict began.
Supply & Demand Analysis
War Scenarios Point to Global Supply Deficit of 1.35–1.90 MBpd in 2026 and AMJ Quarter Most Severe with a deficit of 3.00 - 4.50 MBpd.
Pre-war, global supply and demand were near-balanced with a modest surplus of +0.55 MBpd projected for 2026. Both conflict scenarios introduce significant supply deficits driven by Strait of Hormuz disruptions and impacts on Iraq and Kuwait crude production.
- Scenario 1 (Preferred): Ceasefire talks to remain on a progressive note and flows through the Strait of Hormuz improving over the coming weeks; however crude oil production losses will be there due to further non-availability of storage on on-shore in Iraq, Kuwait and other small Middle East nations.
- Scenario 2 (Alternate): No major deal being achieved from ceasefire talks and post completion of ceasefire talks, tensions continuing to remain in the Middle East and flows through the Strait of Hormuz continuing to remain restrained. Crude Oil Production Facilities & Refining Centers in the Middle East region getting affected and trade disruptions in Strait of Hormuz will be there for medium to long term (4 to 7 months).
Brent Crude 1M Futures are expected to trade in a range of 100 USD/bbl to 125 USD/bbl over the coming 1 to 2 weeks. The coordinated SPR release and GCC bypass capacity provide a meaningful supply cushion that limits sustained upside beyond these levels.
Metals & Energy Market Update – Geopolitical Context (Iran Conflict)
Geopolitical backdrop:

The United States and Iran have signed a 14-point Memorandum of Understanding (MoU) aimed at extending the ceasefire and establishing a framework for a broader peace agreement. The deal includes the reopening of the Strait of Hormuz, a commitment by Iran not to pursue nuclear weapons, and the creation of a proposed $300 billion reconstruction and economic development fund, largely expected to be financed by regional partners rather than the U.S. The agreement outlines a 60-day negotiation period to finalize a comprehensive deal, alongside phased sanctions relief, the release of certain frozen Iranian assets, and the gradual removal of U.S. military and naval restrictions.
Steel:
- Domestic steel prices have moderated from recent highs.
- Steel supply chains remain largely insulated from the Middle East conflict.
- Since, the start of war steel HRC prices are up by 8.7%.
Base metals:
- Copper ended last week up by 2.4%, primarily due to progress in negotiation talks.
- Aluminum rose by 7.9% since start of war linked to Gulf region supply disruptions. However, demand softness and possible peace deal now driving price action.
Precious metals:
- Volatility has eased, but prices face upward pressure, due to improving market sentiment in peace talks.
- However, any esclation and halt in a resolution will pressure on Precious Metals.
- Stronger U.S. yields and weak industrial offtake—especially auto—are suppressing any upside momentum.
LPG Market Update
- India’s LPG market saw another upward revision on 1st June 2026 , with oil marketing companies increasing commercial cylinder prices. Commercial LPG prices were raised across major cities, with the 19 kg cylinder in Delhi increasing by Rs 42 to Rs 3,113.50. Similar hikes were reported nationwide, ranging from Rs 42 to Rs 53.50 per cylinder.
India’s domestic LPG market witnessed a price revision on 7 June 2026, with Oil Marketing Companies (OMCs) increasing the price of the 14.2 kg domestic LPG cylinder by ₹29 per cylinder across the country. - In addition to commercial cylinders, oil marketing companies also increased the price of 5 kg Free Trade LPG (FTL) cylinders by Rs 11. Following the revision, the retail price of a 5 kg FTL cylinder in Delhi now stands at Rs 821.50. FTL cylinders are sold outside the subsidized domestic LPG system and are commonly used by migrant workers, temporary households, street vendors, and consumers requiring smaller LPG packs.
Impact Assessment of US/Israel-Iran Conflict
The US and Iran have reached an interim framework agreement aimed at ending immediate hostilities and creating a pathway for broader negotiations. The agreement is not a final comprehensive treaty but rather a temporary arrangement designed to stabilise the situation and provide a 60-day period for diplomatic discussions on unresolved issues. Both sides have confirmed the agreement, with formal signing expected around 19th Jun’26, in Switzerland.
Core Agreed Elements
- The agreement calls for an immediate cessation of military operations and hostile activities on all fronts, including Lebanon. The ceasefire extends the existing truce for an initial period of 60 days and may be extended further through mutual consent. The objective is to prevent further escalation and create conditions conducive to diplomacy.
- The Strait of Hormuz will be reopened to international commercial shipping. Iran has committed to clearing naval mines and restoring safe navigation through the waterway. Both sides aim to return shipping traffic to pre-conflict levels within approximately 30 days. While US officials have described access as toll-free, Iranian authorities maintain that environmental and maritime traffic management fees may still be collected. Iran retains sovereignty and control over the Strait.
- The US will lift its naval blockade of Iranian ports, allowing normal maritime access and facilitating the resumption of international trade and commercial shipping activities involving Iran.
- The agreement does not resolve the most contentious nuclear issues. Instead, these matters will be addressed during the 60-day negotiation period. Iran has reaffirmed its commitment in principle not to pursue nuclear weapons and has agreed to discuss the future of its enriched uranium stockpile. Specific arrangements concerning uranium removal or reduction, enrichment limits, international inspections, and the potential dismantlement of nuclear facilities remain subject to future negotiations.
- The framework provides for limited and temporary sanctions relief, particularly regarding Iranian oil exports. Discussions will also begin regarding the release of certain frozen Iranian assets. Any broader or permanent sanctions relief will be tied to compliance with future agreements and performance benchmarks established during subsequent negotiations.
Production/Supply Recovery
- A tentative US-Iran framework agreement to end the conflict and reopen the Strait of Hormuz has eased immediate concerns over global energy supplies, sending oil prices lower.
- However, industry experts caution that restoring oil and gas production, refining operations, and shipping flows will take considerable time, with some oil output returning within weeks but full recovery potentially requiring months or years.
- More than 14 MBpd of oil production and significant refining and LNG capacity were disrupted during the conflict, while global oil inventories have fallen sharply.
- Market grapevines expect a gradual recovery, ongoing repair costs running into tens of billions of dollars, and a prolonged period of inventory rebuilding as countries seek to strengthen energy security against future geopolitical risks.
- Although the US and Iran have reached a preliminary agreement to reopen the Strait of Hormuz, maritime security experts warn that normal shipping operations may not resume for 40–50 days due to the need to detect and clear potential naval mines.
- Shipping companies, insurers, and oil traders remain cautious, as even a single mine poses a serious threat to vessels carrying cargoes worth hundreds of millions of dollars.
- Traffic through the strait remains far below pre-war levels, and uncertainty over the extent of Iran's mine deployments continues to hinder confidence. While international naval forces have begun preparations for mine-clearing operations, industry officials say restoring full safety and normal shipping volumes could take weeks or even months, prolonging disruptions to global energy supplies and trade.
War Impact on Crude Oil & Gasoil/Diesel Prices

War Impact on Gasoline, ATF & Natural Gas Prices
GCC Bypass Pipelines Running Near Capacity — But Shah Gas Field Ablaze and Fujairah Zone Struck
- Saudi Arabia's East-West pipeline is pumping oil at its full capacity of 7 MBpd, bypassing the Strait of Hormuz. Crude oil exports from Yanbu port have reached 5 MBpd, and the country is also exporting 0.70 to 0.90 MBpd of oil products.
- Of approximately 15 MBpd of crude transiting the Strait of Hormuz in OND'25, combined SPR releases and bypass pipeline capacity can offset roughly two-thirds — or slightly more — for the next 20 to 30 days, providing the Trump administration a window to assess strategic direction.
- New strikes directly threaten this buffer — Iranian drones struck the UAE's Shah gas field (currently ablaze) and the Fujairah Oil Industry Zone on Mar 17. A tanker was also hit near the Strait of Hormuz. Saudi Arabia intercepted over a dozen drones; Kuwait and Bahrain sustained additional attacks. These represent the first direct strikes on GCC energy export infrastructure since the conflict began.
Supply & Demand Analysis
War Scenarios Point to Global Supply Deficit of 1.35–1.90 MBpd in 2026 and AMJ Quarter Most Severe with a deficit of 3.00 - 4.50 MBpd.
Pre-war, global supply and demand were near-balanced with a modest surplus of +0.55 MBpd projected for 2026. Both conflict scenarios introduce significant supply deficits driven by Strait of Hormuz disruptions and impacts on Iraq and Kuwait crude production.
- Scenario 1 (Preferred): Ceasefire talks to remain on a progressive note and flows through the Strait of Hormuz improving over the coming weeks; however crude oil production losses will be there due to further non-availability of storage on on-shore in Iraq, Kuwait and other small Middle East nations.
- Scenario 2 (Alternate): No major deal being achieved from ceasefire talks and post completion of ceasefire talks, tensions continuing to remain in the Middle East and flows through the Strait of Hormuz continuing to remain restrained. Crude Oil Production Facilities & Refining Centers in the Middle East region getting affected and trade disruptions in Strait of Hormuz will be there for medium to long term (4 to 7 months).
Brent Crude 1M Futures are expected to trade in a range of 100 USD/bbl to 125 USD/bbl over the coming 1 to 2 weeks. The coordinated SPR release and GCC bypass capacity provide a meaningful supply cushion that limits sustained upside beyond these levels.
Metals & Energy Market Update – Geopolitical Context (Iran Conflict)
Geopolitical backdrop:
The United States and Iran have signed a 14-point Memorandum of Understanding (MoU) aimed at extending the ceasefire and establishing a framework for a broader peace agreement. The deal includes the reopening of the Strait of Hormuz, a commitment by Iran not to pursue nuclear weapons, and the creation of a proposed $300 billion reconstruction and economic development fund, largely expected to be financed by regional partners rather than the U.S. The agreement outlines a 60-day negotiation period to finalize a comprehensive deal, alongside phased sanctions relief, the release of certain frozen Iranian assets, and the gradual removal of U.S. military and naval restrictions.
Steel:
- Domestic steel prices have moderated from recent highs.
- Steel supply chains remain largely insulated from the Middle East conflict.
- Since, the start of war steel HRC prices are up by 8.7%.
Base metals:
- Copper ended last week up by 2.4%, primarily due to progress in negotiation talks.
- Aluminum rose by 7.9% since start of war linked to Gulf region supply disruptions. However, demand softness and possible peace deal now driving price action.
Precious metals:
- Volatility has eased, but prices face upward pressure, due to improving market sentiment in peace talks.
- However, any esclation and halt in a resolution will pressure on Precious Metals.
- Stronger U.S. yields and weak industrial offtake—especially auto—are suppressing any upside momentum.
LPG Market Update
- India’s LPG market saw another upward revision on 1st June 2026 , with oil marketing companies increasing commercial cylinder prices. Commercial LPG prices were raised across major cities, with the 19 kg cylinder in Delhi increasing by Rs 42 to Rs 3,113.50. Similar hikes were reported nationwide, ranging from Rs 42 to Rs 53.50 per cylinder.
India’s domestic LPG market witnessed a price revision on 7 June 2026, with Oil Marketing Companies (OMCs) increasing the price of the 14.2 kg domestic LPG cylinder by ₹29 per cylinder across the country. - In addition to commercial cylinders, oil marketing companies also increased the price of 5 kg Free Trade LPG (FTL) cylinders by Rs 11. Following the revision, the retail price of a 5 kg FTL cylinder in Delhi now stands at Rs 821.50. FTL cylinders are sold outside the subsidized domestic LPG system and are commonly used by migrant workers, temporary households, street vendors, and consumers requiring smaller LPG packs.
Impact Assessment of US/Israel-Iran Conflict
The US and Iran have reached an interim framework agreement aimed at ending immediate hostilities and creating a pathway for broader negotiations. The agreement is not a final comprehensive treaty but rather a temporary arrangement designed to stabilise the situation and provide a 60-day period for diplomatic discussions on unresolved issues. Both sides have confirmed the agreement, with formal signing expected around 19th Jun’26, in Switzerland.
Core Agreed Elements
- The agreement calls for an immediate cessation of military operations and hostile activities on all fronts, including Lebanon. The ceasefire extends the existing truce for an initial period of 60 days and may be extended further through mutual consent. The objective is to prevent further escalation and create conditions conducive to diplomacy.
- The Strait of Hormuz will be reopened to international commercial shipping. Iran has committed to clearing naval mines and restoring safe navigation through the waterway. Both sides aim to return shipping traffic to pre-conflict levels within approximately 30 days. While US officials have described access as toll-free, Iranian authorities maintain that environmental and maritime traffic management fees may still be collected. Iran retains sovereignty and control over the Strait.
- The US will lift its naval blockade of Iranian ports, allowing normal maritime access and facilitating the resumption of international trade and commercial shipping activities involving Iran.
- The agreement does not resolve the most contentious nuclear issues. Instead, these matters will be addressed during the 60-day negotiation period. Iran has reaffirmed its commitment in principle not to pursue nuclear weapons and has agreed to discuss the future of its enriched uranium stockpile. Specific arrangements concerning uranium removal or reduction, enrichment limits, international inspections, and the potential dismantlement of nuclear facilities remain subject to future negotiations.
- The framework provides for limited and temporary sanctions relief, particularly regarding Iranian oil exports. Discussions will also begin regarding the release of certain frozen Iranian assets. Any broader or permanent sanctions relief will be tied to compliance with future agreements and performance benchmarks established during subsequent negotiations.
Production/Supply Recovery
- A tentative US-Iran framework agreement to end the conflict and reopen the Strait of Hormuz has eased immediate concerns over global energy supplies, sending oil prices lower.
- However, industry experts caution that restoring oil and gas production, refining operations, and shipping flows will take considerable time, with some oil output returning within weeks but full recovery potentially requiring months or years.
- More than 14 MBpd of oil production and significant refining and LNG capacity were disrupted during the conflict, while global oil inventories have fallen sharply.
- Market grapevines expect a gradual recovery, ongoing repair costs running into tens of billions of dollars, and a prolonged period of inventory rebuilding as countries seek to strengthen energy security against future geopolitical risks.
- Although the US and Iran have reached a preliminary agreement to reopen the Strait of Hormuz, maritime security experts warn that normal shipping operations may not resume for 40–50 days due to the need to detect and clear potential naval mines.
- Shipping companies, insurers, and oil traders remain cautious, as even a single mine poses a serious threat to vessels carrying cargoes worth hundreds of millions of dollars.
- Traffic through the strait remains far below pre-war levels, and uncertainty over the extent of Iran's mine deployments continues to hinder confidence. While international naval forces have begun preparations for mine-clearing operations, industry officials say restoring full safety and normal shipping volumes could take weeks or even months, prolonging disruptions to global energy supplies and trade.
War Impact on Crude Oil & Gasoil/Diesel Prices
War Impact on Gasoline, ATF & Natural Gas Prices
GCC Bypass Pipelines Running Near Capacity — But Shah Gas Field Ablaze and Fujairah Zone Struck
- Saudi Arabia's East-West pipeline is pumping oil at its full capacity of 7 MBpd, bypassing the Strait of Hormuz. Crude oil exports from Yanbu port have reached 5 MBpd, and the country is also exporting 0.70 to 0.90 MBpd of oil products.
- Of approximately 15 MBpd of crude transiting the Strait of Hormuz in OND'25, combined SPR releases and bypass pipeline capacity can offset roughly two-thirds — or slightly more — for the next 20 to 30 days, providing the Trump administration a window to assess strategic direction.
- New strikes directly threaten this buffer — Iranian drones struck the UAE's Shah gas field (currently ablaze) and the Fujairah Oil Industry Zone on Mar 17. A tanker was also hit near the Strait of Hormuz. Saudi Arabia intercepted over a dozen drones; Kuwait and Bahrain sustained additional attacks. These represent the first direct strikes on GCC energy export infrastructure since the conflict began.
Supply & Demand Analysis
War Scenarios Point to Global Supply Deficit of 1.35–1.90 MBpd in 2026 and AMJ Quarter Most Severe with a deficit of 3.00 - 4.50 MBpd.
Pre-war, global supply and demand were near-balanced with a modest surplus of +0.55 MBpd projected for 2026. Both conflict scenarios introduce significant supply deficits driven by Strait of Hormuz disruptions and impacts on Iraq and Kuwait crude production.
- Scenario 1 (Preferred): Ceasefire talks to remain on a progressive note and flows through the Strait of Hormuz improving over the coming weeks; however crude oil production losses will be there due to further non-availability of storage on on-shore in Iraq, Kuwait and other small Middle East nations.
- Scenario 2 (Alternate): No major deal being achieved from ceasefire talks and post completion of ceasefire talks, tensions continuing to remain in the Middle East and flows through the Strait of Hormuz continuing to remain restrained. Crude Oil Production Facilities & Refining Centers in the Middle East region getting affected and trade disruptions in Strait of Hormuz will be there for medium to long term (4 to 7 months).
Brent Crude 1M Futures are expected to trade in a range of 100 USD/bbl to 125 USD/bbl over the coming 1 to 2 weeks. The coordinated SPR release and GCC bypass capacity provide a meaningful supply cushion that limits sustained upside beyond these levels.
Metals & Energy Market Update – Geopolitical Context (Iran Conflict)
Geopolitical backdrop:
Israel and Iran traded the worst exchange of fire since the April truce, with Iran firing missiles at Israeli targets and Israel carrying out strikes on western and central Iran. Brent bounced back strongly as renewed tensions stoked fresh supply fears and Hormuz near-closure continues to put a structural floor under prices. Equities saw sharp selloff in Asia at the open as well, with Kospi down by 14%, Nikkei down by 1.31% and Nifty down by 1.2%, S&P down by 2.64%, and Nasdaq registered a heavy sell-off and marked a 4.18% loss. Higher energy, slower growth, and limited room for rate cuts keep yields elevated. Safe-haven flows are rotating into money markets and short-duration paper.
Steel:
- Domestic steel prices have moderated from recent highs.
- Steel supply chains remain largely insulated from the Middle East conflict.
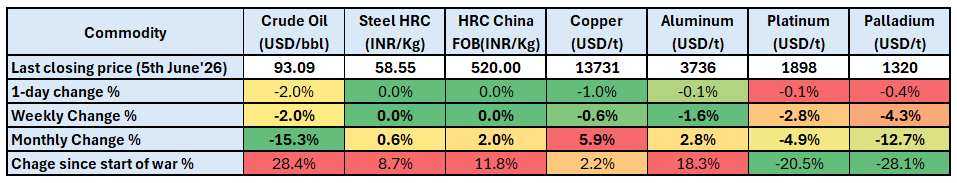
- Since, the start of war steel HRC prices are up by 8.7%.
Base metals:
- Copper ended last week down by 1%, primarily due to stronger dollar and weak demand.
- Aluminum rose by 18.3% since start of war linked to Gulf region supply disruptions. However, demand softness now driving price action.
- IMF downgraded 2026 global growth to 3.1% (from 3.3% earlier and 3.4% in 2025), highlighting war-related downside risks.
Precious metals:
- Volatility has eased, but prices face upward pressure, due to improving market sentiment in peace talks.
- However, any esclation and halt in a resolution will pressure on Precious Metals.
- Stronger U.S. yields and weak industrial offtake—especially auto—are suppressing any upside momentum.
LPG Market Update - 09 June 2026
- India’s LPG market saw another upward revision on 1st June 2026 , with oil marketing companies increasing commercial cylinder prices. Commercial LPG prices were raised across major cities, with the 19 kg cylinder in Delhi increasing by Rs 42 to Rs 3,113.50. Similar hikes were reported nationwide, ranging from Rs 42 to Rs 53.50 per cylinder.
India’s domestic LPG market witnessed a price revision on 7 June 2026, with Oil Marketing Companies (OMCs) increasing the price of the 14.2 kg domestic LPG cylinder by ₹29 per cylinder across the country. - In addition to commercial cylinders, oil marketing companies also increased the price of 5 kg Free Trade LPG (FTL) cylinders by Rs 11. Following the revision, the retail price of a 5 kg FTL cylinder in Delhi now stands at Rs 821.50. FTL cylinders are sold outside the subsidized domestic LPG system and are commonly used by migrant workers, temporary households, street vendors, and consumers requiring smaller LPG packs.
Impact Assessment of US/Israel-Iran Conflict
The US and Iran have reached an interim framework agreement aimed at ending immediate hostilities and creating a pathway for broader negotiations. The agreement is not a final comprehensive treaty but rather a temporary arrangement designed to stabilize the situation and provide a 60-day period for diplomatic discussions on unresolved issues. Both sides have confirmed the agreement, with formal signing expected around 19th Jun’26, in Switzerland.
Core Agreed Elements
- The agreement calls for an immediate cessation of military operations and hostile activities on all fronts, including Lebanon. The ceasefire extends the existing truce for an initial period of 60 days and may be extended further through mutual consent. The objective is to prevent further escalation and create conditions conducive to diplomacy.
- The Strait of Hormuz will be reopened to international commercial shipping. Iran has committed to clearing naval mines and restoring safe navigation through the waterway. Both sides aim to return shipping traffic to pre-conflict levels within approximately 30 days. While US officials have described access as toll-free, Iranian authorities maintain that environmental and maritime traffic management fees may still be collected. Iran retains sovereignty and control over the Strait.
- The US will lift its naval blockade of Iranian ports, allowing normal maritime access and facilitating the resumption of international trade and commercial shipping activities involving Iran.
- The agreement does not resolve the most contentious nuclear issues. Instead, these matters will be addressed during the 60-day negotiation period. Iran has reaffirmed its commitment in principle not to pursue nuclear weapons and has agreed to discuss the future of its enriched uranium stockpile. Specific arrangements concerning uranium removal or reduction, enrichment limits, international inspections, and the potential dismantlement of nuclear facilities remain subject to future negotiations.
- The framework provides for limited and temporary sanctions relief, particularly regarding Iranian oil exports. Discussions will also begin regarding the release of certain frozen Iranian assets. Any broader or permanent sanctions relief will be tied to compliance with future agreements and performance benchmarks established during subsequent negotiations.
Production/Supply Recovery
- A tentative US-Iran framework agreement to end the conflict and reopen the Strait of Hormuz has eased immediate concerns over global energy supplies, sending oil prices lower.
- However, industry experts caution that restoring oil and gas production, refining operations, and shipping flows will take considerable time, with some oil output returning within weeks but full recovery potentially requiring months or years.
- More than 14 MBpd of oil production and significant refining and LNG capacity were disrupted during the conflict, while global oil inventories have fallen sharply.
- Market grapevines expect a gradual recovery, ongoing repair costs running into tens of billions of dollars, and a prolonged period of inventory rebuilding as countries seek to strengthen energy security against future geopolitical risks.
- Although the US and Iran have reached a preliminary agreement to reopen the Strait of Hormuz, maritime security experts warn that normal shipping operations may not resume for 40–50 days due to the need to detect and clear potential naval mines.
- Shipping companies, insurers, and oil traders remain cautious, as even a single mine poses a serious threat to vessels carrying cargoes worth hundreds of millions of dollars.
- Traffic through the strait remains far below pre-war levels, and uncertainty over the extent of Iran's mine deployments continues to hinder confidence. While international naval forces have begun preparations for mine-clearing operations, industry officials say restoring full safety and normal shipping volumes could take weeks or even months, prolonging disruptions to global energy supplies and trade.
War Impact on Crude Oil & Gasoil/Diesel Prices
War Impact on Gasoline, ATF & Natural Gas Prices
GCC Bypass Pipelines Running Near Capacity — But Shah Gas Field Ablaze and Fujairah Zone Struck
- Saudi Arabia's East-West pipeline is pumping oil at its full capacity of 7 MBpd, bypassing the Strait of Hormuz. Crude oil exports from Yanbu port have reached 5 MBpd, and the country is also exporting 0.70 to 0.90 MBpd of oil products.
- Of approximately 15 MBpd of crude transiting the Strait of Hormuz in OND'25, combined SPR releases and bypass pipeline capacity can offset roughly two-thirds — or slightly more — for the next 20 to 30 days, providing the Trump administration a window to assess strategic direction.
- New strikes directly threaten this buffer — Iranian drones struck the UAE's Shah gas field (currently ablaze) and the Fujairah Oil Industry Zone on Mar 17. A tanker was also hit near the Strait of Hormuz. Saudi Arabia intercepted over a dozen drones; Kuwait and Bahrain sustained additional attacks. These represent the first direct strikes on GCC energy export infrastructure since the conflict began.
Supply & Demand Analysis
War Scenarios Point to Global Supply Deficit of 1.35–1.90 MBpd in 2026 and AMJ Quarter Most Severe with a deficit of 3.00 - 4.50 MBpd.
Pre-war, global supply and demand were near-balanced with a modest surplus of +0.55 MBpd projected for 2026. Both conflict scenarios introduce significant supply deficits driven by Strait of Hormuz disruptions and impacts on Iraq and Kuwait crude production.
- Scenario 1 (Preferred): Ceasefire talks to remain on a progressive note and flows through the Strait of Hormuz improving over the coming weeks; however crude oil production losses will be there due to further non-availability of storage on on-shore in Iraq, Kuwait and other small Middle East nations.
- Scenario 2 (Alternate): No major deal being achieved from ceasefire talks and post completion of ceasefire talks, tensions continuing to remain in the Middle East and flows through the Strait of Hormuz continuing to remain restrained. Crude Oil Production Facilities & Refining Centers in the Middle East region getting affected and trade disruptions in Strait of Hormuz will be there for medium to long term (4 to 7 months).
Brent Crude 1M Futures are expected to trade in a range of 100 USD/bbl to 125 USD/bbl over the coming 1 to 2 weeks. The coordinated SPR release and GCC bypass capacity provide a meaningful supply cushion that limits sustained upside beyond these levels.
Metals & Energy Market Update – Geopolitical Context (Iran Conflict)
Geopolitical backdrop:
Israel and Iran traded the worst exchange of fire since the April truce, with Iran firing missiles at Israeli targets and Israel carrying out strikes on western and central Iran. Brent bounced back strongly as renewed tensions stoked fresh supply fears and Hormuz near-closure continues to put a structural floor under prices. Equities saw sharp selloff in Asia at the open as well, with Kospi down by 14%, Nikkei down by 1.31% and Nifty down by 1.2%, S&P down by 2.64%, and Nasdaq registered a heavy sell-off and marked a 4.18% loss. Higher energy, slower growth, and limited room for rate cuts keep yields elevated. Safe-haven flows are rotating into money markets and short-duration paper.
Steel:
- Domestic steel prices have moderated from recent highs.
- Steel supply chains remain largely insulated from the Middle East conflict.
- Since, the start of war steel HRC prices are up by 8.7%.
Base metals:
- Copper ended last week down by 1%, primarily due to stronger dollar and weak demand.
- Aluminum rose by 18.3% since start of war linked to Gulf region supply disruptions. However, demand softness now driving price action.
- IMF downgraded 2026 global growth to 3.1% (from 3.3% earlier and 3.4% in 2025), highlighting war-related downside risks.
Precious metals:
- Volatility has eased, but prices face upward pressure, due to improving market sentiment in peace talks.
- However, any esclation and halt in a resolution will pressure on Precious Metals.
- Stronger U.S. yields and weak industrial offtake—especially auto—are suppressing any upside momentum.
LPG Market Update - 09 June 2026
- India’s LPG market saw another upward revision on 1st June 2026 , with oil marketing companies increasing commercial cylinder prices. Commercial LPG prices were raised across major cities, with the 19 kg cylinder in Delhi increasing by Rs 42 to Rs 3,113.50. Similar hikes were reported nationwide, ranging from Rs 42 to Rs 53.50 per cylinder.
India’s domestic LPG market witnessed a price revision on 7 June 2026, with Oil Marketing Companies (OMCs) increasing the price of the 14.2 kg domestic LPG cylinder by ₹29 per cylinder across the country. - In addition to commercial cylinders, oil marketing companies also increased the price of 5 kg Free Trade LPG (FTL) cylinders by Rs 11. Following the revision, the retail price of a 5 kg FTL cylinder in Delhi now stands at Rs 821.50. FTL cylinders are sold outside the subsidized domestic LPG system and are commonly used by migrant workers, temporary households, street vendors, and consumers requiring smaller LPG packs.