
- WTI Crude May'26 futures and Brent Crude Jun'26 futures prices both fall by around 15% in early trade on 08th Apr'26 (Today) after the US President Trump announced a temporary ceasefire.
- A temporary ceasefire in the Iran war, agreed by US President Donald Trump, will provide relief to economies affected by the world's worst energy crisis. However, the deal's effectiveness remains uncertain, as Iran continued attacks on Israel and Gulf countries after the announcement.
- Around 187 laden tankers carrying nearly 172 mln bbl of crude oil and petroleum products are currently stranded in the Gulf since the war began, awaiting clearance through the Strait of Hormuz.
- Iran reportedly struck Saudi Arabia’s Jubail Industrial City, a major petrochemical hub with an estimated production capacity of approx. 60 mln tons per year, producing key downstream products such as plastics, fertilizers, industrial chemicals, and synthetic materials.
- The attack caused fires at parts of the complex, including facilities linked to major producers like SABIC, though the full extent of damage and operational disruption remains unclear.
- While Jubail is critical to Saudi Arabia’s industrial base and exports, there is no confirmation of large-scale destruction or immediate global supply disruption, with the situation still evolving.
- European and Asian refiners are paying record high prices of near 150 USD/bbl for some crude oil grades due to the US-Israel war with Iran, which has forced the shutdown of about 12% of world supply.
- Spot premiums for US West Texas Intermediate crude have surged to record highs (30 - 40 USD/bbl) due to increased competition between Asian and European refiners vying to replace Middle Eastern oil flows disrupted by the Iran war.
- Iraq's state-run Basra Oil Company head, said that if the Iran war ends and the Strait of Hormuz reopens, Iraq could restore crude oil exports to around 3.4 MBpd within a week. However, Iraq has not received formal documents from Iran regarding permission for Iraqi tankers to pass through the Strait.
- Crude oil exports from Russia's Sheskharis terminal in Novorossiysk were suspended due to a drone attack and fire. The terminal typically loads 0.7 MBpd, adding strain to Russian infrastructure.
- OPEC+ agreed to raise its oil output quotas by 0.21 MBpd for May'26, but the increase is largely symbolic as key members are unable to raise production due to the US-Israeli war with Iran.
IEA member nations have agreed to a coordinated release of 400 mln bbl — the largest emergency SPR release since the IEA was founded after the 1973 Oil Crisis. The US, under the Trump administration, is contributing 172 mln bbl structured as loans to companies with repayment including a premium.
Deliveries are expected to begin reaching the market by the end of next week and will continue over approximately 120 days. The first batch of 86 mln bbl has already been opened for bidding. Japan will released 80 mln bbl beginning 16th Mar'26.
IEA Region-wise Release Breakdown
Key Supply Infrastructure
GCC Bypass Pipelines Running Near Capacity — But Shah Gas Field Ablaze and Fujairah Zone Struck
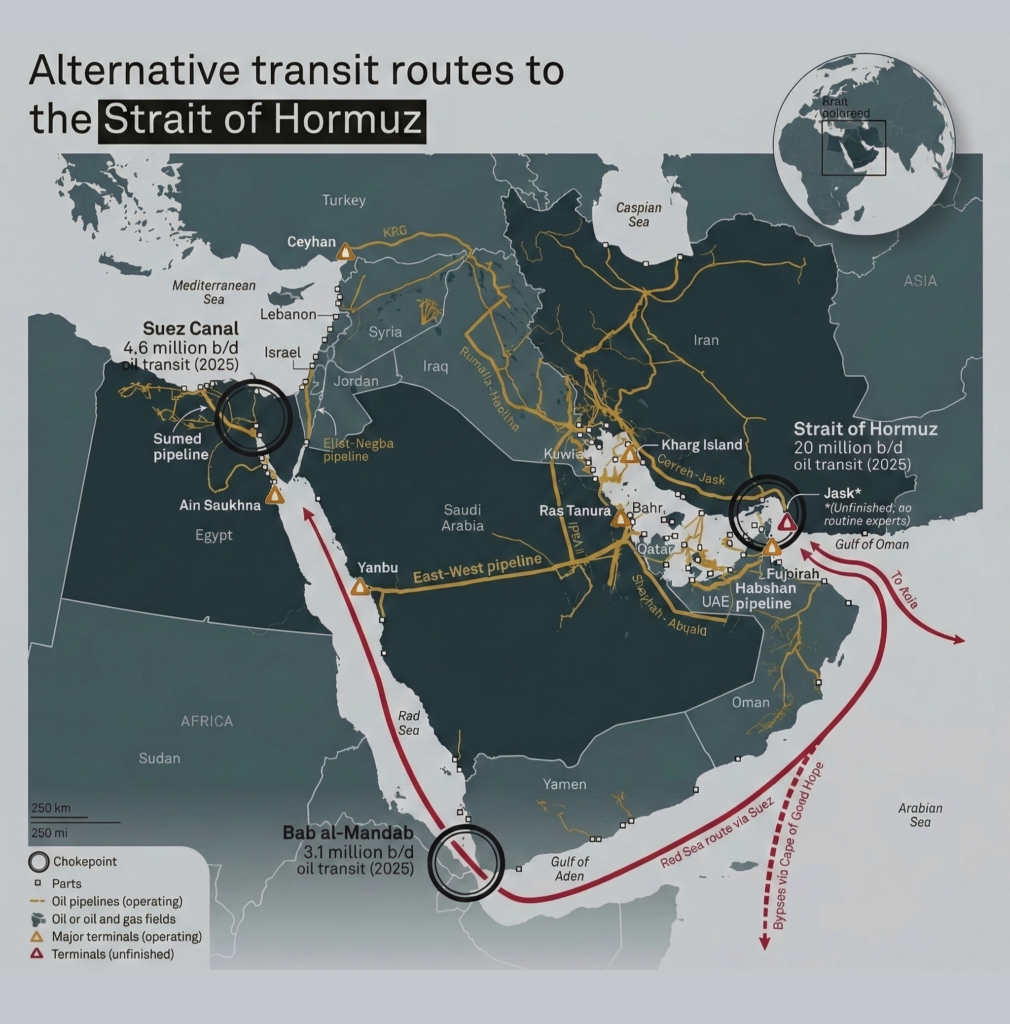
- Saudi Arabia's East-West pipeline is pumping oil at its full capacity of 7 MBpd, bypassing the Strait of Hormuz. Crude oil exports from Yanbu port have reached 5 MBpd, and the country is also exporting 0.70 to 0.90 MBpd of oil products.
- Of approximately 15 MBpd of crude transiting the Strait of Hormuz in OND'25, combined SPR releases and bypass pipeline capacity can offset roughly two-thirds — or slightly more — for the next 20 to 30 days, providing the Trump administration a window to assess strategic direction.
- New strikes directly threaten this buffer — Iranian drones struck the UAE's Shah gas field (currently ablaze) and the Fujairah Oil Industry Zone on Mar 17. A tanker was also hit near the Strait of Hormuz. Saudi Arabia intercepted over a dozen drones; Kuwait and Bahrain sustained additional attacks. These represent the first direct strikes on GCC energy export infrastructure since the conflict began.
Supply & Demand Analysis
War Scenarios Point to Global Supply Deficit of 1.35–1.90 MBpd in 2026 and AMJ Quarter Most Severe with a deficit of 3.00 - 4.50 MBpd.
Pre-war, global supply and demand were near-balanced with a modest surplus of +0.55 MBpd projected for 2026. Both conflict scenarios introduce significant supply deficits driven by Strait of Hormuz disruptions and impacts on Iraq and Kuwait crude production.
- Scenario 1 (Preferred): Exchange of attacks between US/Israel and Iran continuing, leading to severe/significant/complete disruptions of crude oil and its products trade through the Strait of Hormuz, severely impacting Iraq's and Kuwait's crude oil production over the next 3 to 6 months. Full-year 2026 deficit: −1.90 MBpd. AMJ quarter most acute at −4.50 MBpd.
- Scenario 2 (Alternate): Partial disruptions of crude oil trade through the Strait of Hormuz, with Iran not targeting ships and oil tankers moving toward China, India, and select Asian nations outside the Western alliance. Full-year 2026 deficit: −1.35 MBpd. Balance returns to flat by OND '26.
- On the US front, US retail sales recorded a solid rebound in Feb'26, rising 0.6% MoM and 3.7% on YoY, marking the strongest gain in seven months, supported by a recovery in motor vehicle purchases and seasonal factors. Core retail sales also came in firm at 0.5% MoM, indicating underlying consumption strength, with higher tax refunds playing a key role in sustaining household spending during the period.
- The US manufacturing activity continued to expand, with ISM PMI rising to 52.7 in March, its highest level since Aug'22. That said, the improvement was partly driven by slower supplier deliveries, reflecting supply chain disruptions rather than demand strength, particularly amid shipping constraints and trade frictions. This has also led to a sharp rise in input cost pressures, with the prices paid index jumping significantly, signaling building inflation at the producer level.
Brent Crude 1M Futures are expected to trade in a range of 90 USD/bbl to 120 USD/bbl over the coming 1 to 2 weeks. The coordinated SPR release and GCC bypass capacity provide a meaningful supply cushion that limits sustained upside beyond these levels.
LPG Market Update
Commercial LPG Price Hike — 1st April 2026 (Delhi)
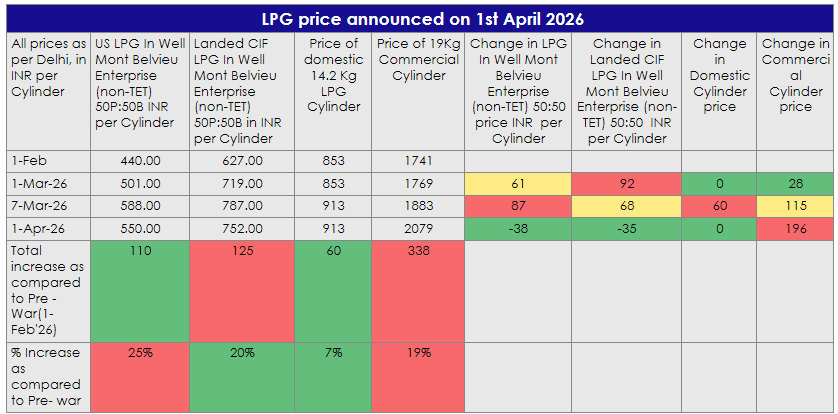
- Commercial LPG prices increased by ₹195.50 per 19-kg cylinder on April 1, 2026. A 19-kg cylinder now costs ₹2,078.50 in Delhi — up from ₹1,883 earlier.
- This is the second monthly increase, following a ₹114.50 rise in March. The hike affects restaurants, hotels, and small businesses. The adjustment indicates that prior increases in international prices, along with possible margin realignments, are still being passed through in the domestic market.
- In comparison, the 14.2 kg domestic LPG cylinder price has increased by only ₹60 (7%), with no change in the latest revision. This indicates a relatively controlled and stable pricing approach for household consumers, in contrast to the continued upward adjustments in the commercial segment.
- International LPG benchmarks have also seen increases over the period, with Mont Belvieu prices rising by ₹110 (25%) and Landed CIF prices by ₹125 (20%) on 1st Apr'26 as compared to 1st Feb'26. However, the magnitude of increase in commercial LPG prices, particularly in absolute terms, remains notably higher than that of domestic cylinders.
India’s LPG import slump in March'26 signals Gulf disruption impact, triggers strategic shift toward US supply
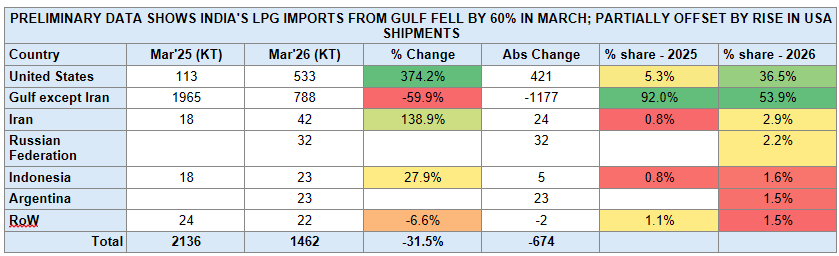
- India’s LPG import profile shifted sharply in March, with total volumes declining 31.5% MoM to 1,462 KT (down 674 KT), driven by a steep 59.9% drop in Gulf supplies (ex-Iran) to 788 KT (-1,177 KT), reducing their share from 92.0% to 53.9% amid disruptions around the Strait of Hormuz.
- This was partially offset by a surge in imports from the United States, which rose 374% MoM to 533 KT (+421 KT), lifting its share to 36.5%, alongside incremental volumes from Iran (42 KT, +139%), the Russian Federation (32 KT), Indonesia (23 KT, +27.9%), and Argentina (23 KT).
- Despite this rebalancing, the shift toward long-haul cargoes implies higher freight intensity and longer supply chains, reinforcing near-term tightness and upward pressure on delivered LPG costs.
India’s LPG balance under pressure as Hormuz disruptions persist, with vessel arrivals providing short-term supply relief
- India’s LPG supply–demand balance remains under near-term pressure amid geopolitical disruptions, with domestic demand estimated at 92.6–95.0 KT/day (~33 MMT annually), of which 55–60 KT/day (60–65%) is met through imports and ~35 KT/day from domestic production; notably, ~90% of imports transit through the Strait of Hormuz, creating significant exposure to ongoing disruptions.
- Recent vessel inflows have provided partial relief, with Hellas Gladiator (24 KT, Netherlands) and Gas Jupiter (24 KT, United States) having arrived on March 30 at Ennore Port and Visakhapatnam Port respectively, followed by BW TYR reaching Mumbai on March 31; BW ELM is expected to arrive at Mangaluru on April 1 after successfully transiting the Strait of Hormuz under Indian Navy escort as part of Operation Urja Suraksha.
- Earlier arrivals of Jag Vasant and Pine Gas (combined 92.6 KT; March 26–27) added roughly one day of national demand cover, along with the previously discharged Shivalik and Nanda Devi cargoes (92.5 KT; March 15–16) offering temporary relief despite persistent structural supply risks.