
Impact Assessment of US/Israel-Iran Conflict
Impact Assessment of US/Israel-Iran Conflict
- The US crude oil output fell by 0.41 MBpd in Jan'26, the most in two years, due to a severe winter storm that disrupted production. Gasoline demand fell sharply during January's winter storms, while distillate fuel consumption surged as unusually low temperatures increased consumption for power generation and space heating.
- The US Gulf Coast refiners imported the most crude oil from Venezuela since Mar'25 in Jan'26, with imports rising to 6.2 MBpd from 3.8 MBpd in Dec'25.
- Market grapevine indicates that OPEC oil output plummeted in Mar'26 to its lowest level since Jun'20 due to the US/Israeli-Iran war, which effectively closed the Strait of Hormuz and forced export cuts.
- Crude output by OPEC members fell by 7.3 MBpd to 21.57 MBpd, led by cuts in Kuwait, Iraq, Saudi Arabia, and UAE.
- Ukrainian drones have targeted Russia's Baltic Sea port of Ust-Luga five times in the past 10 days, with industry sources telling Reuters that an oil loading terminal was hit.
- This follows a series of attacks on Russia's oil export infrastructure, with at least 40% of its export capacity halted due to drone strikes and other disruptions.
- Crude oil production resumed at Libya's Sharara and El Feel oilfields after completing maintenance on a crude export pipeline. The fields had been shut down due to pipeline damage and a suspension in operations.
- Sharara is one of Libya's largest production areas, with a capacity of between 0.30and 0.32 MBpd.
IEA member nations have agreed to a coordinated release of 400 mln bbl — the largest emergency SPR release since the IEA was founded after the 1973 Oil Crisis. The US, under the Trump administration, is contributing 172 mln bbl structured as loans to companies with repayment including a premium.
Deliveries are expected to begin reaching the market by the end of next week and will continue over approximately 120 days. The first batch of 86 mln bbl has already been opened for bidding. Japan will release 80 mln bbl beginning 16th Mar'26.
IEA Region-wise Release Breakdown — As of 15 Mar 2026
Key Supply Infrastructure
GCC Bypass Pipelines Running Near Capacity — But Shah Gas Field Ablaze and Fujairah Zone Struck
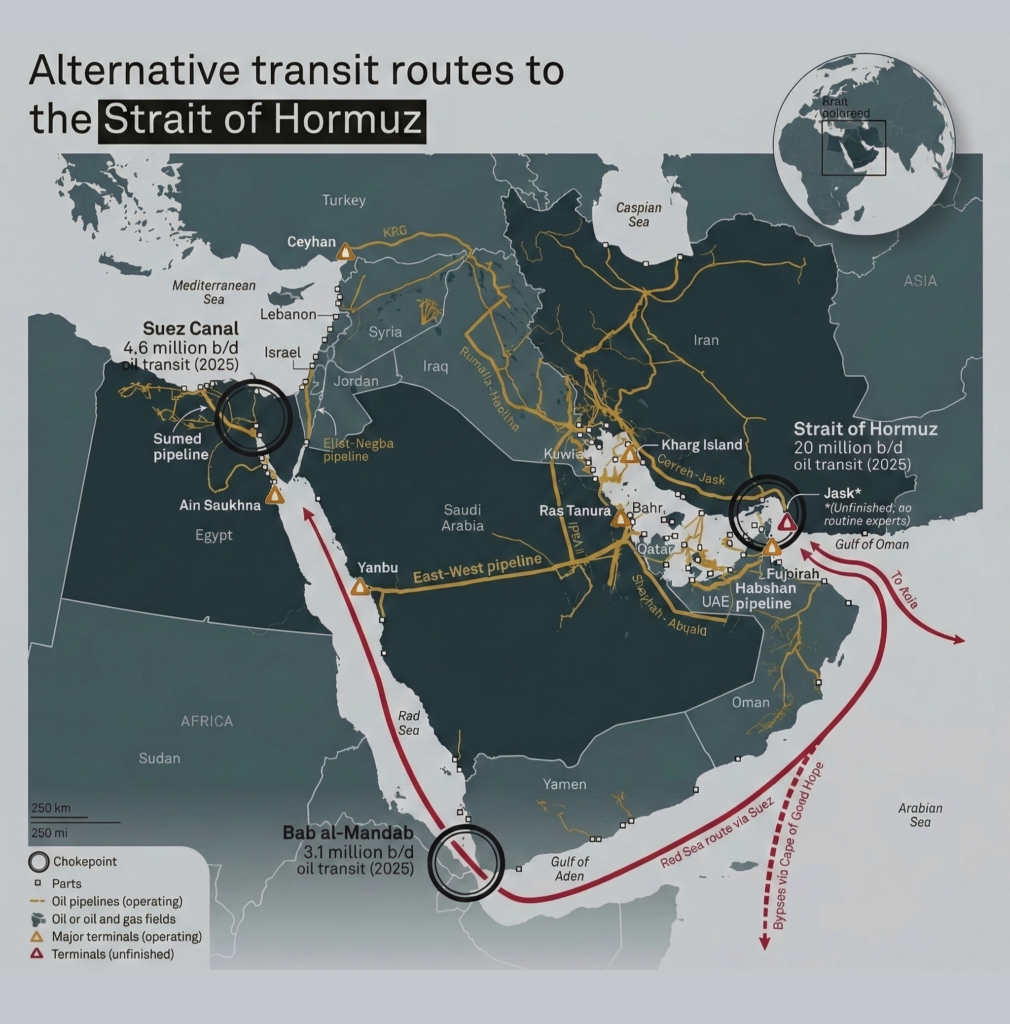
- Saudi Arabia's East-West pipeline is pumping oil at its full capacity of 7 MBpd, bypassing the Strait of Hormuz. Crude oil exports from Yanbu port have reached 5 MBpd, and the country is also exporting 0.70 to 0.90 MBpd of oil products.
- Of approximately 15 MBpd of crude transiting the Strait of Hormuz in OND'25, combined SPR releases and bypass pipeline capacity can offset roughly two-thirds — or slightly more — for the next 20 to 30 days, providing the Trump administration a window to assess strategic direction.
- New strikes directly threaten this buffer — Iranian drones struck the UAE's Shah gas field (currently ablaze) and the Fujairah Oil Industry Zone on Mar 17. A tanker was also hit near the Strait of Hormuz. Saudi Arabia intercepted over a dozen drones; Kuwait and Bahrain sustained additional attacks. These represent the first direct strikes on GCC energy export infrastructure since the conflict began.
War Scenarios Point to Global Supply Deficit of 1.35–1.90 MBpd in 2026; AMJ Quarter Most Severe
Pre-war, global supply and demand were near-balanced with a modest surplus of +0.55 MBpd projected for 2026. Both conflict scenarios introduce significant supply deficits driven by Strait of Hormuz disruptions and impacts on Iraq and Kuwait crude production.
- Scenario 1 (Preferred): Exchange of attacks between US/Israel and Iran continuing, leading to severe/significant/complete disruptions of crude oil and its products trade through the Strait of Hormuz, severely impacting Iraq's and Kuwait's crude oil production over the next 3 to 6 months. Full-year 2026 deficit: −1.90 MBpd. AMJ quarter most acute at −4.50 MBpd.
- Scenario 2 (Alternate): Partial disruptions of crude oil trade through the Strait of Hormuz, with Iran not targeting ships and oil tankers moving toward China, India, and select Asian nations outside the Western alliance. Full-year 2026 deficit: −1.35 MBpd. Balance returns to flat by OND '26.
- The US Dollar Index edged higher in yesterday's session, rising from 100.15 to 100.50 level, trading near a 10-month high. The index recorded a daily gain of 0.36% and advanced 1.58% on a weekly basis.
- The upward move was primarily supported by safe-haven demand amid escalating geopolitical tensions in the Middle East, particularly the ongoing Iran–Israel conflict, which weighed on global risk sentiment and drove capital flows toward the dollar.
- On the US front, US weekly jobless claims show a stable labor market with limited layoffs, despite macro risks from Middle East tensions and trade uncertainty. Initial claims rose modestly by 5K to 210K, in line with expectations, while continuing claims fell 32K to 1.819M, the lowest in nearly two years, indicating steady absorption of unemployed workers.
- The labor market remains in a “low-hire, low-fire” phase, though rising oil prices, tariff uncertainty, and tightening labor supply are starting to weigh on job growth, keeping the Fed cautious and supportive of a wait-and-watch approach amid inflation risks.
Brent Expected to Trade 90–120 USD/bbl
Brent Crude 1M Futures are expected to trade in a range of 90 USD/bbl to 120 USD/bbl over the coming 1 to 2 weeks. The coordinated SPR release and GCC bypass capacity provide a meaningful supply cushion that limits sustained upside beyond these levels.
LPG Market Update
India’s LPG import slump in March'26 signals Gulf disruption impact, triggers strategic shift toward US supply
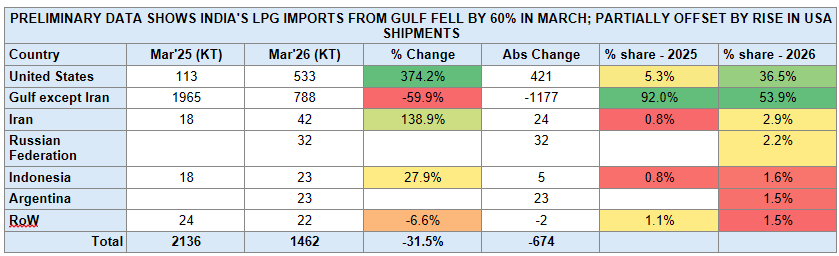
- India’s LPG import profile shifted sharply in March, with total volumes declining 31.5% MoM to 1,462 KT (down 674 KT), driven by a steep 59.9% drop in Gulf supplies (ex-Iran) to 788 KT (-1,177 KT), reducing their share from 92.0% to 53.9% amid disruptions around the Strait of Hormuz.
- This was partially offset by a surge in imports from the United States, which rose 374% MoM to 533 KT (+421 KT), lifting its share to 36.5%, alongside incremental volumes from Iran (42 KT, +139%), the Russian Federation (32 KT), Indonesia (23 KT, +27.9%), and Argentina (23 KT).
- Despite this rebalancing, the shift toward long-haul cargoes implies higher freight intensity and longer supply chains, reinforcing near-term tightness and upward pressure on delivered LPG costs.
India’s LPG balance under pressure as Hormuz disruptions persist, with vessel arrivals providing short-term supply relief
- India’s LPG supply–demand balance remains under near-term pressure amid geopolitical disruptions, with domestic demand estimated at 92.6–95.0 KT/day (~33 MMT annually), of which 55–60 KT/day (60–65%) is met through imports and ~35 KT/day from domestic production; notably, ~90% of imports transit through the Strait of Hormuz, creating significant exposure to ongoing disruptions.
- Recent vessel inflows have provided partial relief, with Hellas Gladiator (24 KT, Netherlands) and Gas Jupiter (24 KT, United States) having arrived on March 30 at Ennore Port and Visakhapatnam Port respectively, followed by BW TYR reaching Mumbai on March 31; BW ELM is expected to arrive at Mangaluru on April 1 after successfully transiting the Strait of Hormuz under Indian Navy escort as part of Operation Urja Suraksha.
- Earlier arrivals of Jag Vasant and Pine Gas (combined 92.6 KT; March 26–27) added roughly one day of national demand cover, along with the previously discharged Shivalik and Nanda Devi cargoes (92.5 KT; March 15–16) offering temporary relief despite persistent structural supply risks.
Impact Assessment of US/Israel-Iran Conflict
Nayara Energy Refinery Maintenance Update:
- Based on multiple sources, Nayara Energy is planning to go for a maintenance for a period of around 35 days from early Apr’26. Already, earlier in Dec’25, Nayara Energy postponed it’s refinery maintenance due to some vendor related constraints related to Catalysts (because of EU Sanctions related to Russian Crude oil buying). To ensure the safety & efficiency of Refinery, Nayara is planning to go for this maintenance from early Apr’26.
- Nayara has a Refinery capacity of 20 million tons per Annum and PP Production capacity of 450 thousand tons per Annum. Despite possible buffer stocks of Petroleum Products & PP Resin availability during the maintenance, amid ongoing crisis of LPG & Polymers Shortage in domestic market, this plant maintenance during Apr’26 is going to further tighten LPG & PP Resin supplies in the domestic market providing support to PP Resin prices.
- Multiple PP production plants in India got affected over the last 3 months, RIL Jamnagar. Amid current government restrictions over diversion of Propane to LPG rather than for PP production, more plants like MRPL, GAIL, RIL, OPaL production are also expected to get impacted.
- A fire on a fully loaded Kuwaiti oil tanker hit by an Iranian attack at Dubai Port was extinguished, raising concerns about a possible oil spill. The tanker was loaded with 2 mln bbl of crude oil from Kuwait and Saudi Arabia, with a destination of Qingdao, China.
- Crude oil production resumed at Libya's Sharara and El Feel oilfields after completing maintenance on a crude export pipeline. The fields had been shut down due to pipeline damage and a suspension in operations.
- Sharara is one of Libya's largest production areas, with a capacity of between 0.30and 0.32 MBpd.
- The risk of an expanded Iran war grew on Saturday as Yemen's Iran-aligned Houthis launched their first attacks on Israel since the start of the conflict, even as additional US forces reached the Middle East.
- Saudi Arabia's East-West pipeline is pumping oil at its full capacity of 7 MBpd, bypassing the Strait of Hormuz. Crude oil exports from Yanbu port have reached 5 MBpd, and the country is also exporting 0.70 to 0.90 MBpd of oil products.
- Russian Deputy Prime Minister instructed the energy ministry to draft a resolution banning gasoline exports from 01st Apr'26. The ban will remain in place until 31st Jul'26 due to global oil market turmoil caused by the Middle East crisis.
- Russia has imposed export curbs on gasoline and diesel to control rising fuel prices and tackle shortages. Last year, Russia exported nearly 0.12 MBpd of gasoline.
- The US President Trump extended a pause on attacks against Iran’s energy infrastructure until 06th Apr'26, amid ongoing but disputed talks, as the prolonged conflict continues to strain global markets and raise inflation concerns.
IEA member nations have agreed to a coordinated release of 400 mln bbl — the largest emergency SPR release since the IEA was founded after the 1973 Oil Crisis. The US, under the Trump administration, is contributing 172 mln bbl structured as loans to companies with repayment including a premium.
Deliveries are expected to begin reaching the market by the end of next week and will continue over approximately 120 days. The first batch of 86 mln bbl has already been opened for bidding. Japan will release 80 mln bbl beginning 16th Mar'26.
IEA Region-wise Release Breakdown — As of 15 Mar 2026
Key Supply Infrastructure
GCC Bypass Pipelines Running Near Capacity — But Shah Gas Field Ablaze and Fujairah Zone Struck
- Saudi Arabia's East-West pipeline is pumping oil at its full capacity of 7 MBpd, bypassing the Strait of Hormuz. Crude oil exports from Yanbu port have reached 5 MBpd, and the country is also exporting 0.70 to 0.90 MBpd of oil products.
- Of approximately 15 MBpd of crude transiting the Strait of Hormuz in OND'25, combined SPR releases and bypass pipeline capacity can offset roughly two-thirds — or slightly more — for the next 20 to 30 days, providing the Trump administration a window to assess strategic direction.
- New strikes directly threaten this buffer — Iranian drones struck the UAE's Shah gas field (currently ablaze) and the Fujairah Oil Industry Zone on Mar 17. A tanker was also hit near the Strait of Hormuz. Saudi Arabia intercepted over a dozen drones; Kuwait and Bahrain sustained additional attacks. These represent the first direct strikes on GCC energy export infrastructure since the conflict began.
War Scenarios Point to Global Supply Deficit of 1.35–1.90 MBpd in 2026; AMJ Quarter Most Severe
Pre-war, global supply and demand were near-balanced with a modest surplus of +0.55 MBpd projected for 2026. Both conflict scenarios introduce significant supply deficits driven by Strait of Hormuz disruptions and impacts on Iraq and Kuwait crude production.
- Scenario 1 (Preferred): Exchange of attacks between US/Israel and Iran continuing, leading to severe/significant/complete disruptions of crude oil and its products trade through the Strait of Hormuz, severely impacting Iraq's and Kuwait's crude oil production over the next 3 to 6 months. Full-year 2026 deficit: −1.90 MBpd. AMJ quarter most acute at −4.50 MBpd.
- Scenario 2 (Alternate): Partial disruptions of crude oil trade through the Strait of Hormuz, with Iran not targeting ships and oil tankers moving toward China, India, and select Asian nations outside the Western alliance. Full-year 2026 deficit: −1.35 MBpd. Balance returns to flat by OND '26.
- The US Dollar Index edged higher in yesterday's session, rising from 100.15 to 100.50 level, trading near a 10-month high. The index recorded a daily gain of 0.36% and advanced 1.58% on a weekly basis.
- The upward move was primarily supported by safe-haven demand amid escalating geopolitical tensions in the Middle East, particularly the ongoing Iran–Israel conflict, which weighed on global risk sentiment and drove capital flows toward the dollar.
- On the US front, US weekly jobless claims show a stable labor market with limited layoffs, despite macro risks from Middle East tensions and trade uncertainty. Initial claims rose modestly by 5K to 210K, in line with expectations, while continuing claims fell 32K to 1.819M, the lowest in nearly two years, indicating steady absorption of unemployed workers.
- The labor market remains in a “low-hire, low-fire” phase, though rising oil prices, tariff uncertainty, and tightening labor supply are starting to weigh on job growth, keeping the Fed cautious and supportive of a wait-and-watch approach amid inflation risks.
Brent Expected to Trade 90–120 USD/bbl
Brent Crude 1M Futures are expected to trade in a range of 90 USD/bbl to 120 USD/bbl over the coming 1 to 2 weeks. The coordinated SPR release and GCC bypass capacity provide a meaningful supply cushion that limits sustained upside beyond these levels.
Impact Assessment of US/Israel-Iran Conflict
Nayara Energy Refinery Maintenance Update:
- Based on multiple sources, Nayara Energy is planning to go for a maintenance for a period of around 35 days from early Apr’26. Already, earlier in Dec’25, Nayara Energy postponed it’s refinery maintenance due to some vendor related constraints related to Catalysts (because of EU Sanctions related to Russian Crude oil buying). To ensure the safety & efficiency of Refinery, Nayara is planning to go for this maintenance from early Apr’26.
- Nayara has a Refinery capacity of 20 million tons per Annum and PP Production capacity of 450 thousand tons per Annum. Despite possible buffer stocks of Petroleum Products & PP Resin availability during the maintenance, amid ongoing crisis of LPG & Polymers Shortage in domestic market, this plant maintenance during Apr’26 is going to further tighten LPG & PP Resin supplies in the domestic market providing support to PP Resin prices.
- Multiple PP production plants in India got affected over the last 3 months, RIL Jamnagar. Amid current government restrictions over diversion of Propane to LPG rather than for PP production, more plants like MRPL, GAIL, RIL, OPaL production are also expected to get impacted.
- The risk of an expanded Iran war grew on Saturday as Yemen's Iran-aligned Houthis launched their first attacks on Israel since the start of the conflict, even as additional US forces reached the Middle East.
- Russian Deputy Prime Minister instructed the energy ministry to draft a resolution banning gasoline exports from 01st Apr'26. The ban will remain in place until 31st Jul'26 due to global oil market turmoil caused by the Middle East crisis.
- Russia has imposed export curbs on gasoline and diesel to control rising fuel prices and tackle shortages. Last year, Russia exported nearly 0.12 MBpd of gasoline.
- The US President Trump extended a pause on attacks against Iran’s energy infrastructure until 06th Apr'26, amid ongoing but disputed talks, as the prolonged conflict continues to strain global markets and raise inflation concerns.
- Russia’s Kirishinefteorgsintez refinery, one of the country’s largest, halted operations after Ukrainian drone attacks sparked fires, further straining oil supply as significant export capacity is already disrupted.
- The attacks also impacted key Baltic export routes, with loadings at Primorsk and Ust-Luga suspended, worsening Russia’s ongoing supply challenges.
- At least 40% of Russia's oil export capacity has halted due to Ukrainian drone attacks, a disputed attack on a major pipeline, and the seizure of tankers. This is the most severe oil supply disruption in modern Russian history, hitting Moscow as oil prices exceed 100 USD/bbl.
- Russia's major oil export terminals Primorsk and Ust-Luga suspended crude oil and oil products loadings on 25th Mar'26 after Ukrainian drone attacks sparked fires, with smoke visible from Finland.
- The US energy firms cut oil and natural gas rigs for the first time since mid-Jan'26, with the total rig count falling to 543 in the week to 27th Mar'26. The decline puts the total rig count down 49 rigs, or 8.3% below this time last year, with oil rigs falling to 409 and gas rigs falling to 127.
IEA member nations have agreed to a coordinated release of 400 mln bbl — the largest emergency SPR release since the IEA was founded after the 1973 Oil Crisis. The US, under the Trump administration, is contributing 172 mln bbl structured as loans to companies with repayment including a premium.
Deliveries are expected to begin reaching the market by the end of next week and will continue over approximately 120 days. The first batch of 86 mln bbl has already been opened for bidding. Japan will release 80 mln bbl beginning 16th Mar'26.
IEA Region-wise Release Breakdown — As of 15 Mar 2026
Key Supply Infrastructure
GCC Bypass Pipelines Running Near Capacity — But Shah Gas Field Ablaze and Fujairah Zone Struck
- Saudi Arabia's East-West pipeline is pumping oil at its full capacity of 7 MBpd, bypassing the Strait of Hormuz. Crude oil exports from Yanbu port have reached 5 MBpd, and the country is also exporting 0.70 to 0.90 MBpd of oil products.
- Of approximately 15 MBpd of crude transiting the Strait of Hormuz in OND'25, combined SPR releases and bypass pipeline capacity can offset roughly two-thirds — or slightly more — for the next 20 to 30 days, providing the Trump administration a window to assess strategic direction.
- New strikes directly threaten this buffer — Iranian drones struck the UAE's Shah gas field (currently ablaze) and the Fujairah Oil Industry Zone on Mar 17. A tanker was also hit near the Strait of Hormuz. Saudi Arabia intercepted over a dozen drones; Kuwait and Bahrain sustained additional attacks. These represent the first direct strikes on GCC energy export infrastructure since the conflict began.
War Scenarios Point to Global Supply Deficit of 1.35–1.90 MBpd in 2026; AMJ Quarter Most Severe
Pre-war, global supply and demand were near-balanced with a modest surplus of +0.55 MBpd projected for 2026. Both conflict scenarios introduce significant supply deficits driven by Strait of Hormuz disruptions and impacts on Iraq and Kuwait crude production.
- Scenario 1 (Preferred): Exchange of attacks between US/Israel and Iran continuing, leading to severe/significant/complete disruptions of crude oil and its products trade through the Strait of Hormuz, severely impacting Iraq's and Kuwait's crude oil production over the next 3 to 6 months. Full-year 2026 deficit: −1.90 MBpd. AMJ quarter most acute at −4.50 MBpd.
- Scenario 2 (Alternate): Partial disruptions of crude oil trade through the Strait of Hormuz, with Iran not targeting ships and oil tankers moving toward China, India, and select Asian nations outside the Western alliance. Full-year 2026 deficit: −1.35 MBpd. Balance returns to flat by OND '26.
- The Federal Reserve decided to maintain the federal funds rate unchanged at 3.50%-3.75%, emphasizing its commitment to maximum employment and returning inflation to the 2% target. While uncertainty around the economic outlook remains elevated, particularly due to developments in West Asia, the Fed slightly revised up its GDP growth projections, kept unemployment broadly unchanged, and raised inflation projections for 2026–2027, signaling a more persistent inflation outlook.
Brent Expected to Trade 90–120 USD/bbl
Brent Crude 1M Futures are expected to trade in a range of 90 USD/bbl to 120 USD/bbl over the coming 1 to 2 weeks. The coordinated SPR release and GCC bypass capacity provide a meaningful supply cushion that limits sustained upside beyond these levels.
Impact Assessment of US/Israel-Iran Conflict
Nayara Energy Refinery Maintenance Update:
- Based on multiple sources, Nayara Energy is planning to go for a maintenance for a period of around 35 days from early Apr’26. Already, earlier in Dec’25, Nayara Energy postponed it’s refinery maintenance due to some vendor related constraints related to Catalysts (because of EU Sanctions related to Russian Crude oil buying). To ensure the safety & efficiency of Refinery, Nayara is planning to go for this maintenance from early Apr’26.
- Nayara has a Refinery capacity of 20 million tons per Annum and PP Production capacity of 450 thousand tons per Annum. Despite possible buffer stocks of Petroleum Products & PP Resin availability during the maintenance, amid ongoing crisis of LPG & Polymers Shortage in domestic market, this plant maintenance during Apr’26 is going to further tighten LPG & PP Resin supplies in the domestic market providing support to PP Resin prices.
- Multiple PP production plants in India got affected over the last 3 months, RIL Jamnagar. Amid current government restrictions over diversion of Propane to LPG rather than for PP production, more plants like MRPL, GAIL, RIL, OPaL production are also expected to get impacted.
- At least 40% of Russia's oil export capacity has halted due to Ukrainian drone attacks, a disputed attack on a major pipeline, and the seizure of tankers. This is the most severe oil supply disruption in modern Russian history, hitting Moscow as oil prices exceed 100 USD/bbl.
- Russia's major oil export terminals Primorsk and Ust-Luga suspended crude oil and oil products loadings on 25th Mar'26 after Ukrainian drone attacks sparked fires, with smoke visible from Finland.
- The drone attacks are likely to add to uncertainty on global oil markets. Ukraine has stepped up drone attacks on Russian oil refineries and export routes in an attempt to weaken Russia's war economy and as peace talks have stalled.
IEA member nations have agreed to a coordinated release of 400 mln bbl — the largest emergency SPR release since the IEA was founded after the 1973 Oil Crisis. The US, under the Trump administration, is contributing 172 mln bbl structured as loans to companies with repayment including a premium.
Deliveries are expected to begin reaching the market by the end of next week and will continue over approximately 120 days. The first batch of 86 mln bbl has already been opened for bidding. Japan will release 80 mln bbl beginning 16th Mar'26.
IEA Region-wise Release Breakdown — As of 15 Mar 2026
Key Supply Infrastructure
GCC Bypass Pipelines Running Near Capacity — But Shah Gas Field Ablaze and Fujairah Zone Struck
- Saudi Arabia's East–West Pipeline and the UAE's ADCOP are fully operational, providing combined bypass capacity of approximately 6.5–7.0 MBpd above pre-conflict export levels. Both lines are running at or near maximum utilisation as of mid-Mar 2026.
- Of approximately 15 MBpd of crude transiting the Strait of Hormuz in OND'25, combined SPR releases and bypass pipeline capacity can offset roughly two-thirds — or slightly more — for the next 20 to 30 days, providing the Trump administration a window to assess strategic direction.
- New strikes directly threaten this buffer — Iranian drones struck the UAE's Shah gas field (currently ablaze) and the Fujairah Oil Industry Zone on Mar 17. A tanker was also hit near the Strait of Hormuz. Saudi Arabia intercepted over a dozen drones; Kuwait and Bahrain sustained additional attacks. These represent the first direct strikes on GCC energy export infrastructure since the conflict began.
War Scenarios Point to Global Supply Deficit of 1.35–1.90 MBpd in 2026; AMJ Quarter Most Severe
Pre-war, global supply and demand were near-balanced with a modest surplus of +0.55 MBpd projected for 2026. Both conflict scenarios introduce significant supply deficits driven by Strait of Hormuz disruptions and impacts on Iraq and Kuwait crude production.
- Scenario 1 (Preferred): Exchange of attacks between US/Israel and Iran continuing, leading to severe/significant/complete disruptions of crude oil and its products trade through the Strait of Hormuz, severely impacting Iraq's and Kuwait's crude oil production over the next 3 to 6 months. Full-year 2026 deficit: −1.90 MBpd. AMJ quarter most acute at −4.50 MBpd.
- Scenario 2 (Alternate): Partial disruptions of crude oil trade through the Strait of Hormuz, with Iran not targeting ships and oil tankers moving toward China, India, and select Asian nations outside the Western alliance. Full-year 2026 deficit: −1.35 MBpd. Balance returns to flat by OND '26.
- The US Dollar Index edged higher in the session, rising from 98.95 to 99.434 level, marking a 0.5% day on day basis rise, while remaining down by 0.1% on a weekly basis. The downside was primarily driven by a pullback in US.
- Treasury yields, as market sentiment improved following indications from Donald Trump that the US would avoid targeting key infrastructure in Iran, easing near-term geopolitical risk and reducing safe-haven demand for the dollar.
- Additionally, strength in the Euro further pressured the index, given its heavy weight in the DXY basket, amplifying the overall downside move.
- The Federal Reserve decided to maintain the federal funds rate unchanged at 3.50%-3.75%, emphasizing its commitment to maximum employment and returning inflation to the 2% target. While uncertainty around the economic outlook remains elevated, particularly due to developments in West Asia, the Fed slightly revised up its GDP growth projections, kept unemployment broadly unchanged, and raised inflation projections for 2026–2027, signaling a more persistent inflation outlook.
Brent Expected to Trade 90–120 USD/bbl
Brent Crude 1M Futures are expected to trade in a range of 90 USD/bbl to 120 USD/bbl over the coming 1 to 2 weeks. The coordinated SPR release and GCC bypass capacity provide a meaningful supply cushion that limits sustained upside beyond these levels.
Impact Assessment of US/Israel-Iran Conflict
- An explosion and fire at Valero Energy Corp's 0.38 MBpd oil refinery in Port Arthur, Texas, temporarily shut down the facility. No injuries were reported, and the cause remains under investigation.
- The refinery outage contributes to rising gasoline and diesel prices due to Iran's closure of the Strait of Hormuz, a key oil and refined product waterway for Middle East producers.
- Kazakhstan's crude production has been restored after disruptions caused by Ukrainian drone attacks on the CPC pipeline and power outages at the Tengiz oilfield.
- The CPC pipeline is crucial for Kazakhstan's exports, and the country is seeking to avoid sanctions and attacks. Kazakhstan's output is now at 1.7 MBpd, with potential for further growth as companies invest in drilling deep wells.
- The US President Trump announced on 23rd Mar'26 that the US and Iran have had 'major points of agreement' in recent talks, suggesting a deal could be reached soon to settle the war.
- Trump said his Middle East envoy Steve Witkoff and close aide Jared Kushner spoke with the Iranians, and discussions would continue. He added that if the talks work out, the Strait of Hormuz will be 'opened very soon' and jointly controlled.
- The US Energy Secretary Chris Wright said global oil prices have not climbed enough to cause demand destruction, even as they remain near $100 a barrel due to the US-Israeli war on Iran. The Trump administration is releasing oil from the US Strategic Petroleum Reserve and prioritizing oil supply to Asian refineries.
- Japan plans to release oil from joint stockpiles held by producing nations in the country by the end of Mar'26. According to IEA, Japan's contribution to a record oil stockpile release coordinated by the International Energy Agency will total nearly 80 million barrels, consisting mainly of crude oil.
- Iraq declared force majeure on all oilfields developed by foreign companies due to military operations disrupting navigation through the Strait of Hormuz, halting most of the country's crude exports.
- The Strait of Hormuz is a chokepoint for around 20% of global oil and liquefied natural gas supplies. Iraq's Oil Minister Hayan Abdel-Ghani said crude production at Basra Oil Company has been cut to 0.90 MBpd from 3.3 MBpd, straining the country's already fragile finances as it relies on crude sales for nearly all public spending and more than 90% of its income.
IEA member nations have agreed to a coordinated release of 400 mln bbl — the largest emergency SPR release since the IEA was founded after the 1973 Oil Crisis. The US, under the Trump administration, is contributing 172 mln bbl structured as loans to companies with repayment including a premium.
Deliveries are expected to begin reaching the market by the end of next week and will continue over approximately 120 days. The first batch of 86 mln bbl has already been opened for bidding. Japan will release 80 mln bbl beginning 16th Mar'26.
IEA Region-wise Release Breakdown — As of 15 Mar 2026
Key Supply Infrastructure
GCC Bypass Pipelines Running Near Capacity — But Shah Gas Field Ablaze and Fujairah Zone Struck
- Saudi Arabia's East–West Pipeline and the UAE's ADCOP are fully operational, providing combined bypass capacity of approximately 6.5–7.0 MBpd above pre-conflict export levels. Both lines are running at or near maximum utilisation as of mid-Mar 2026.
- Of approximately 15 MBpd of crude transiting the Strait of Hormuz in OND'25, combined SPR releases and bypass pipeline capacity can offset roughly two-thirds — or slightly more — for the next 20 to 30 days, providing the Trump administration a window to assess strategic direction.
- New strikes directly threaten this buffer — Iranian drones struck the UAE's Shah gas field (currently ablaze) and the Fujairah Oil Industry Zone on Mar 17. A tanker was also hit near the Strait of Hormuz. Saudi Arabia intercepted over a dozen drones; Kuwait and Bahrain sustained additional attacks. These represent the first direct strikes on GCC energy export infrastructure since the conflict began.
War Scenarios Point to Global Supply Deficit of 1.35–1.90 MBpd in 2026; AMJ Quarter Most Severe
Pre-war, global supply and demand were near-balanced with a modest surplus of +0.55 MBpd projected for 2026. Both conflict scenarios introduce significant supply deficits driven by Strait of Hormuz disruptions and impacts on Iraq and Kuwait crude production.
- Scenario 1 (Preferred): Exchange of attacks between US/Israel and Iran continuing, leading to severe/significant/complete disruptions of crude oil and its products trade through the Strait of Hormuz, severely impacting Iraq's and Kuwait's crude oil production over the next 3 to 6 months. Full-year 2026 deficit: −1.90 MBpd. AMJ quarter most acute at −4.50 MBpd.
- Scenario 2 (Alternate): Partial disruptions of crude oil trade through the Strait of Hormuz, with Iran not targeting ships and oil tankers moving toward China, India, and select Asian nations outside the Western alliance. Full-year 2026 deficit: −1.35 MBpd. Balance returns to flat by OND '26.
- The US Dollar Index edged higher in the session, rising from 98.95 to 99.434 level, marking a 0.5% day on day basis rise, while remaining down by 0.1% on a weekly basis. The downside was primarily driven by a pullback in US.
- Treasury yields, as market sentiment improved following indications from Donald Trump that the US would avoid targeting key infrastructure in Iran, easing near-term geopolitical risk and reducing safe-haven demand for the dollar.
- Additionally, strength in the Euro further pressured the index, given its heavy weight in the DXY basket, amplifying the overall downside move.
- The Federal Reserve decided to maintain the federal funds rate unchanged at 3.50%-3.75%, emphasizing its commitment to maximum employment and returning inflation to the 2% target. While uncertainty around the economic outlook remains elevated, particularly due to developments in West Asia, the Fed slightly revised up its GDP growth projections, kept unemployment broadly unchanged, and raised inflation projections for 2026–2027, signaling a more persistent inflation outlook.
Brent Expected to Trade 90–120 USD/bbl
Brent Crude 1M Futures are expected to trade in a range of 90 USD/bbl to 120 USD/bbl over the coming 1 to 2 weeks. The coordinated SPR release and GCC bypass capacity provide a meaningful supply cushion that limits sustained upside beyond these levels.
Impact Assessment of US/Israel-Iran Conflict
- The US President Trump announced on 23rd Mar'26 that the US and Iran have had 'major points of agreement' in recent talks, suggesting a deal could be reached soon to settle the war.
- Trump said his Middle East envoy Steve Witkoff and close aide Jared Kushner spoke with the Iranians, and discussions would continue. He added that if the talks work out, the Strait of Hormuz will be 'opened very soon' and jointly controlled.
- The US Energy Secretary Chris Wright said global oil prices have not climbed enough to cause demand destruction, even as they remain near $100 a barrel due to the US-Israeli war on Iran. The Trump administration is releasing oil from the US Strategic Petroleum Reserve and prioritizing oil supply to Asian refineries.
- Japan plans to release oil from joint stockpiles held by producing nations in the country by the end of Mar'26. According to IEA, Japan's contribution to a record oil stockpile release coordinated by the International Energy Agency will total nearly 80 million barrels, consisting mainly of crude oil.
- Iraq declared force majeure on all oilfields developed by foreign companies due to military operations disrupting navigation through the Strait of Hormuz, halting most of the country's crude exports.
- The Strait of Hormuz is a chokepoint for around 20% of global oil and liquefied natural gas supplies. Iraq's Oil Minister Hayan Abdel-Ghani said crude production at Basra Oil Company has been cut to 0.90 MBpd from 3.3 MBpd, straining the country's already fragile finances as it relies on crude sales for nearly all public spending and more than 90% of its income.
- Saudi Aramco, the world's top oil exporter, has cut crude supply to Asian buyers for a second month in April due to the U.S.-Israeli war with Iran disrupting trade via the Strait of Hormuz.
- The producer is supplying only Arab Light crude exported from the Red Sea port of Yanbu to term customers in Apr'26, keeping supplies to Asian refineries tight and capping their refined products output. Saudi Arabia has exported 4.36 MBpd of crude so far in Mar'26, down from 7.11 MBpd in Feb'26, and the producer is trying to boost crude exports via Yanbu to offset the Strait of Hormuz disruption.
- Traders have offered Iranian oil to Indian refiners at a premium to ICE Brent after Washington temporarily removed sanctions to ease the energy crisis caused by the US-Israeli war on Iran. India, the world's third-biggest oil importer and consumer, has not received a cargo from Tehran since May 2019 after it came under US pressure not to buy Iranian crude.
- Two tankers bound for India sailed through the Strait of Hormuz on 23rd Mar'26, as the US President Trump threatened to attack Iran’s power plants.
IEA member nations have agreed to a coordinated release of 400 mln bbl — the largest emergency SPR release since the IEA was founded after the 1973 Oil Crisis. The US, under the Trump administration, is contributing 172 mln bbl structured as loans to companies with repayment including a premium.
Deliveries are expected to begin reaching the market by the end of next week and will continue over approximately 120 days. The first batch of 86 mln bbl has already been opened for bidding. Japan will release 80 mln bbl beginning 16th Mar'26.
IEA Region-wise Release Breakdown — As of 15 Mar 2026
Key Supply Infrastructure
GCC Bypass Pipelines Running Near Capacity — But Shah Gas Field Ablaze and Fujairah Zone Struck
- Saudi Arabia's East–West Pipeline and the UAE's ADCOP are fully operational, providing combined bypass capacity of approximately 6.5–7.0 MBpd above pre-conflict export levels. Both lines are running at or near maximum utilisation as of mid-Mar 2026.
- Of approximately 15 MBpd of crude transiting the Strait of Hormuz in OND'25, combined SPR releases and bypass pipeline capacity can offset roughly two-thirds — or slightly more — for the next 20 to 30 days, providing the Trump administration a window to assess strategic direction.
- New strikes directly threaten this buffer — Iranian drones struck the UAE's Shah gas field (currently ablaze) and the Fujairah Oil Industry Zone on Mar 17. A tanker was also hit near the Strait of Hormuz. Saudi Arabia intercepted over a dozen drones; Kuwait and Bahrain sustained additional attacks. These represent the first direct strikes on GCC energy export infrastructure since the conflict began.
War Scenarios Point to Global Supply Deficit of 1.35–1.90 MBpd in 2026; AMJ Quarter Most Severe
Pre-war, global supply and demand were near-balanced with a modest surplus of +0.55 MBpd projected for 2026. Both conflict scenarios introduce significant supply deficits driven by Strait of Hormuz disruptions and impacts on Iraq and Kuwait crude production.
- Scenario 1 (Preferred): Exchange of attacks between US/Israel and Iran continuing, leading to severe/significant/complete disruptions of crude oil and its products trade through the Strait of Hormuz, severely impacting Iraq's and Kuwait's crude oil production over the next 3 to 6 months. Full-year 2026 deficit: −1.90 MBpd. AMJ quarter most acute at −4.50 MBpd.
- Scenario 2 (Alternate): Partial disruptions of crude oil trade through the Strait of Hormuz, with Iran not targeting ships and oil tankers moving toward China, India, and select Asian nations outside the Western alliance. Full-year 2026 deficit: −1.35 MBpd. Balance returns to flat by OND '26.
- The US Dollar Index edged higher in the session, rising from 99.23 to 99.64 level marking a 0.42% increase on a daily basis, though it remains down 0.71% on a weekly basis.
- The near-term uptick was largely driven by a modest shift in rate expectations, where markets slightly pushed back the timing of cuts from the Federal Reserve, alongside a parallel rise in U.S. Treasury yields.
- At the same time, ongoing geopolitical tensions in the Middle East continued to support safe-haven demand for the dollar, adding to the upside momentum during the session.
- The Federal Reserve decided to maintain the federal funds rate unchanged at 3.50%-3.75%, emphasizing its commitment to maximum employment and returning inflation to the 2% target. While uncertainty around the economic outlook remains elevated, particularly due to developments in West Asia, the Fed slightly revised up its GDP growth projections, kept unemployment broadly unchanged, and raised inflation projections for 2026–2027, signaling a more persistent inflation outlook.
Brent Expected to Trade 90–120 USD/bbl
Brent Crude 1M Futures are expected to trade in a range of 90 USD/bbl to 120 USD/bbl over the coming 1 to 2 weeks. The coordinated SPR release and GCC bypass capacity provide a meaningful supply cushion that limits sustained upside beyond these levels.
Impact Assessment of US/Israel-Iran Conflict
- Iraq declared force majeure on all oilfields developed by foreign companies due to military operations disrupting navigation through the Strait of Hormuz, halting most of the country's crude exports.
- The Strait of Hormuz is a chokepoint for around 20% of global oil and liquefied natural gas supplies. Iraq's Oil Minister Hayan Abdel-Ghani said crude production at Basra Oil Company has been cut to 0.90 MBpd from 3.3 MBpd, straining the country's already fragile finances as it relies on crude sales for nearly all public spending and more than 90% of its income.
- Saudi Aramco, the world's top oil exporter, has cut crude supply to Asian buyers for a second month in April due to the U.S.-Israeli war with Iran disrupting trade via the Strait of Hormuz.
- The producer is supplying only Arab Light crude exported from the Red Sea port of Yanbu to term customers in Apr'26, keeping supplies to Asian refineries tight and capping their refined products output. Saudi Arabia has exported 4.36 MBpd of crude so far in Mar'26, down from 7.11 MBpd in Feb'26, and the producer is trying to boost crude exports via Yanbu to offset the Strait of Hormuz disruption.
- Indian refiners plan to resume buying Iranian oil after Washington temporarily removed sanctions to alleviate an energy crunch caused by the U.S.-Israeli war on Iran.
- Three Indian refining sources said they will buy Iranian oil and are awaiting government directions and clarity from Washington on details such as payment terms. About 170 mln bbl of Iranian crude are at sea, on ships scattered from the Middle East Gulf to the waters near China.
- The Trump administration has lent 45.2 mln bbl of crude oil from the Strategic Petroleum Reserve to oil companies to control prices that have spiked to four-year highs due to the war on Iran.
- The initial batch covers 52% of the up to 86 mln bbl the administration planned to lend, with the US aiming to lend 172 mln bbl for delivery throughout this year and into next.
- Companies awarded the initial SPR loans include BP Products North America, Gunvor USA, Marathon Petroleum, and Shell Trading. Companies will return the oil with extra barrels as a premium, a system the Energy Department says was meant to stabilize markets at no cost to American taxpayers.
- Iraq overtook Russia as India's biggest oil supplier in Feb'26, with imports from Iraq rising to two-year highs of 1.2 MBpd. Indian refiners began reducing Russian oil intake from Dec'25, with imports in Feb'26 falling 32% year-on-year to about 1.0 MBpd.
- Russian barrels remain central to India's crude import strategy, with imports potentially reaching 2.0 to 2.2 MBpd in Mar'26.
IEA member nations have agreed to a coordinated release of 400 mln bbl — the largest emergency SPR release since the IEA was founded after the 1973 Oil Crisis. The US, under the Trump administration, is contributing 172 mln bbl structured as loans to companies with repayment including a premium.
Deliveries are expected to begin reaching the market by the end of next week and will continue over approximately 120 days. The first batch of 86 mln bbl has already been opened for bidding. Japan will release 80 mln bbl beginning 16th Mar'26.
IEA Region-wise Release Breakdown — As of 15 Mar 2026
Key Supply Infrastructure
GCC Bypass Pipelines Running Near Capacity — But Shah Gas Field Ablaze and Fujairah Zone Struck
- Saudi Arabia's East–West Pipeline and the UAE's ADCOP are fully operational, providing combined bypass capacity of approximately 6.5–7.0 MBpd above pre-conflict export levels. Both lines are running at or near maximum utilisation as of mid-Mar 2026.
- Of approximately 15 MBpd of crude transiting the Strait of Hormuz in OND'25, combined SPR releases and bypass pipeline capacity can offset roughly two-thirds — or slightly more — for the next 20 to 30 days, providing the Trump administration a window to assess strategic direction.
- New strikes directly threaten this buffer — Iranian drones struck the UAE's Shah gas field (currently ablaze) and the Fujairah Oil Industry Zone on Mar 17. A tanker was also hit near the Strait of Hormuz. Saudi Arabia intercepted over a dozen drones; Kuwait and Bahrain sustained additional attacks. These represent the first direct strikes on GCC energy export infrastructure since the conflict began.
War Scenarios Point to Global Supply Deficit of 1.35–1.90 MBpd in 2026; AMJ Quarter Most Severe
Pre-war, global supply and demand were near-balanced with a modest surplus of +0.55 MBpd projected for 2026. Both conflict scenarios introduce significant supply deficits driven by Strait of Hormuz disruptions and impacts on Iraq and Kuwait crude production.
- Scenario 1 (Preferred): Exchange of attacks between US/Israel and Iran continuing, leading to severe/significant/complete disruptions of crude oil and its products trade through the Strait of Hormuz, severely impacting Iraq's and Kuwait's crude oil production over the next 3 to 6 months. Full-year 2026 deficit: −1.90 MBpd. AMJ quarter most acute at −4.50 MBpd.
- Scenario 2 (Alternate): Partial disruptions of crude oil trade through the Strait of Hormuz, with Iran not targeting ships and oil tankers moving toward China, India, and select Asian nations outside the Western alliance. Full-year 2026 deficit: −1.35 MBpd. Balance returns to flat by OND '26.
- The US Dollar Index edged higher in the session, rising from 99.23 to 99.64 level marking a 0.42% increase on a daily basis, though it remains down 0.71% on a weekly basis.
- The near-term uptick was largely driven by a modest shift in rate expectations, where markets slightly pushed back the timing of cuts from the Federal Reserve, alongside a parallel rise in U.S. Treasury yields.
- At the same time, ongoing geopolitical tensions in the Middle East continued to support safe-haven demand for the dollar, adding to the upside momentum during the session.
- The Federal Reserve decided to maintain the federal funds rate unchanged at 3.50%-3.75%, emphasizing its commitment to maximum employment and returning inflation to the 2% target. While uncertainty around the economic outlook remains elevated, particularly due to developments in West Asia, the Fed slightly revised up its GDP growth projections, kept unemployment broadly unchanged, and raised inflation projections for 2026–2027, signaling a more persistent inflation outlook.
Brent Expected to Trade 90–120 USD/bbl
Brent Crude 1M Futures are expected to trade in a range of 90 USD/bbl to 120 USD/bbl over the coming 1 to 2 weeks. The coordinated SPR release and GCC bypass capacity provide a meaningful supply cushion that limits sustained upside beyond these levels.
Impact Assessment of US/Israel-Iran Conflict
- Israeli strike kills top Iranian official — Israel announced the elimination of Iran's national security chief Ali Larijani, Iran's de-facto leader, in a targeted airstrike in Tehran. The kill was confirmed by the Israeli Defence Minister, marking the most significant leadership strike of the entire conflict.
- Iran firesfresh missile salvo at Israel — Iran launched cluster missiles and fresh barrages hitting central Israel with multiple impact sites reported, injuring at least one person. Simultaneous drone and rocket attacks targeted the US Embassy in Baghdad, causing explosions and injuries to personnel.
- Iran escalates on Gulf & shipping — Iranian drones struck the UAE's Shah gas field (set ablaze) and the Fujairah Oil Industry Zone. Another tanker was hit near the Strait of Hormuz. Saudi Arabia intercepted over a dozen drones amid simultaneous attacks targeting Kuwait and Bahrain.
- Israeli and US strikes intensify — The Israeli Air Force conducted over 200 additional strikes on Iranian command centres, air defences, and infrastructure across western and central Iran in the past 24 hours. The US is deploying further military assets to the Middle East.
The Trump administration is using the current 20–30 day supply buffer window to assess a clearer long-term strategic direction. Until a definitive war or de-escalation plan emerges, crude prices will remain highly event-driven and volatile.
SPR / IEAIEA member nations have agreed to a coordinated release of 400 mln bbl — the largest emergency SPR release since the IEA was founded after the 1973 Oil Crisis. The US, under the Trump administration, is contributing 172 mln bbl structured as loans to companies with repayment including a premium.
Deliveries are expected to begin reaching the market by the end of next week and will continue over approximately 120 days. The first batch of 86 mln bbl has already been opened for bidding. Japan will release 80 mln bbl beginning 16th Mar'26.
IEA Region-wise Release Breakdown — As of 15 Mar 2026
Key Supply Infrastructure
GCC Bypass Pipelines Running Near Capacity — But Shah Gas Field Ablaze and Fujairah Zone Struck
- Saudi Arabia's East–West Pipeline and the UAE's ADCOP are fully operational, providing combined bypass capacity of approximately 6.5–7.0 MBpd above pre-conflict export levels. Both lines are running at or near maximum utilisation as of mid-Mar 2026.
- Of approximately 15 MBpd of crude transiting the Strait of Hormuz in OND'25, combined SPR releases and bypass pipeline capacity can offset roughly two-thirds — or slightly more — for the next 20 to 30 days, providing the Trump administration a window to assess strategic direction.
- New strikes directly threaten this buffer — Iranian drones struck the UAE's Shah gas field (currently ablaze) and the Fujairah Oil Industry Zone on Mar 17. A tanker was also hit near the Strait of Hormuz. Saudi Arabia intercepted over a dozen drones; Kuwait and Bahrain sustained additional attacks. These represent the first direct strikes on GCC energy export infrastructure since the conflict began.
War Scenarios Point to Global Supply Deficit of 1.35–1.90 MBpd in 2026; AMJ Quarter Most Severe
Pre-war, global supply and demand were near-balanced with a modest surplus of +0.55 MBpd projected for 2026. Both conflict scenarios introduce significant supply deficits driven by Strait of Hormuz disruptions and impacts on Iraq and Kuwait crude production.
- Scenario 1 (Preferred): Exchange of attacks between US/Israel and Iran continuing, leading to severe/significant/complete disruptions of crude oil and its products trade through the Strait of Hormuz, severely impacting Iraq's and Kuwait's crude oil production over the next 3 to 6 months. Full-year 2026 deficit: −1.90 MBpd. AMJ quarter most acute at −4.50 MBpd.
- Scenario 2 (Alternate): Partial disruptions of crude oil trade through the Strait of Hormuz, with Iran not targeting ships and oil tankers moving toward China, India, and select Asian nations outside the Western alliance. Full-year 2026 deficit: −1.35 MBpd. Balance returns to flat by OND '26.
- The US Dollar Index declined during the session, falling from 99.71 to 99.57, marking a 0.14% day-to-day decrease, though it remains around 0.75% higher on a weekly basis. The decline was largely driven by a risk-on shift in market sentiment, as US equities moved higher during the session, reducing short-term demand for the dollar.
- In addition, profit-taking after the recent rally in the greenback where DXY touched 10 month high, contributed to the pullback. Despite the short-term decline, the broader trend in the dollar has remained supported by greater clarity around the U.S. interest-rate outlook and heightened geopolitical tensions.
Brent Expected to Trade 90–120 USD/bbl
Brent Crude 1M Futures are expected to trade in a range of 90 USD/bbl to 120 USD/bbl over the coming 1 to 2 weeks. The coordinated SPR release and GCC bypass capacity provide a meaningful supply cushion that limits sustained upside beyond these levels.
Impact Assessment of US/Israel-Iran Conflict
Deliveries are expected to begin reaching the market by the end of next week and will continue over approximately 120 days. The first batch of 86 million barrels has already been opened for bidding. Japan will release 80 million barrels beginning March 16, 2026.
| Event | Year | Release | Scale vs. 2026 |
|---|---|---|---|
| First Gulf War | 1991 | 75 mln bbl | |
| Hurricanes Katrina & Rita | 2005 | 60 mln bbl | |
| Libya Civil War | 2011 | 60 mln bbl | |
| Russia–Ukraine War | 2022 | 180 mln bbl | |
| US/Israel–Iran War ★ | 2026 | 400 mln bbl |
| IEA Region | Govt. Stocks (mln bbl) | Obligated Industry Stocks (mln bbl) | Other (mln bbl) | Crude Oil | Oil Products |
|---|---|---|---|---|---|
| Americas | 172.2 | — | 23.6 | 100% | — |
| Asia Oceania | 66.8 | 41.8 | — | 60% | 40% |
| Europe | 32.7 | 74.8 | — | 32% | 68% |
| Total IEA | 271.7 | 116.6 | 23.6 | 72% | 28% |
US deliveries flow into the market over a 120-day window. Combined with GCC bypass pipeline capacity, the SPR mechanism limits sustained price upside. The loan structure (with repayment premium) signals a temporary buffer — markets will watch replenishment dynamics once the conflict stabilises.
The strikes on Shah gas field and Fujairah represent a direct Iranian attempt to degrade the very bypass capacity markets are relying on. Any confirmed damage to the East–West Pipeline or ADCOP would significantly narrow the 20–30 day supply offset window and push prices sharply toward — or potentially beyond — the $110/bbl ceiling.
| Period | Global Supply | Global Demand | S&D Balance |
|---|---|---|---|
| 2025e | 103.57 | 102.94 | +0.63 |
| 2026p | 104.29 | 103.74 | +0.55 |
| JFM '26p | 103.80 | 103.50 | +0.30 |
| AMJ '26p | 104.40 | 103.75 | +0.65 |
| JAS '26p | 104.35 | 103.80 | +0.55 |
| OND '26p | 104.60 | 103.90 | +0.70 |
| Period | Supply | Demand | Balance |
|---|---|---|---|
| 2025e | 103.57 | 102.94 | +0.63 |
| 2026p | 100.23 | 102.13 | −1.90 |
| JFM '26p | 101.80 | 102.80 | −1.00 |
| AMJ '26p | 97.10 | 101.60 | −4.50 |
| JAS '26p | 100.00 | 102.00 | −2.00 |
| OND '26p | 102.00 | 102.10 | −0.10 |
| Period | Supply | Demand | Balance |
|---|---|---|---|
| 2025e | 103.57 | 102.94 | +0.63 |
| 2026p | 101.10 | 102.45 | −1.35 |
| JFM '26p | 102.10 | 103.00 | −0.90 |
| AMJ '26p | 99.10 | 102.10 | −3.00 |
| JAS '26p | 100.80 | 102.30 | −1.50 |
| OND '26p | 102.40 | 102.40 | 0.00 |
Scenario 1 (Preferred): Exchange of attacks between US/Israel and Iran continuing, leading to severe/significant/complete disruptions of crude oil and its products trade through the Strait of Hormuz, severely impacting Iraq's and Kuwait's crude oil production over the next 3 to 6 months. Full-year 2026 deficit: −1.90 MBpd. AMJ quarter most acute at −4.50 MBpd.
Scenario 2 (Alternate): Partial disruptions of crude oil trade through the Strait of Hormuz, with Iran not targeting ships and oil tankers moving toward China, India, and select Asian nations outside the Western alliance. Full-year 2026 deficit: −1.35 MBpd. Balance returns to flat by OND '26.
Movement toward — or beyond — $120/bbl is likely if: (1) Iran retaliates massively for the Larijani killing with strikes on GCC pipeline or port infrastructure, (2) confirmed damage to the Shah gas field or Fujairah zone materially disrupts UAE export capacity, (3) further tanker strikes escalate Strait of Hormuz risk, or (4) SPR drawdown confirmation is delayed. Conversely, any credible ceasefire signal or de-escalation would pull prices sharply back toward the $90–$95/bbl floor.