

Base Metals
TransGraph specializes in providing Base Metals Price research and market analysis.
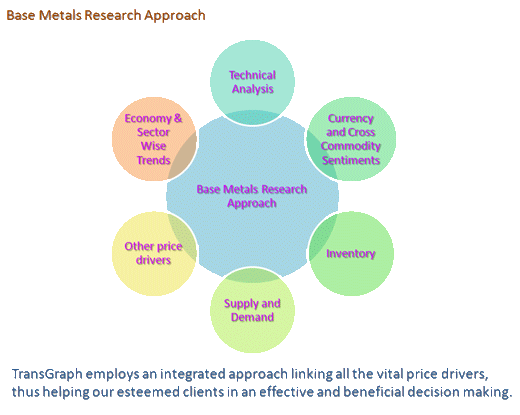
With its unique approach of mapping the market thought applied in combination of
extensive physical and financial markets knowledge and experience, TransGraph delivers
services in a wide range of activities including Research, Market Intelligence,
Feasibility studies, Pricing advisory, Price Risk Management and trade advisory.
We track all major forward /futures markets, Spot Markets, options and over-the
counter products for client hedging / risk management requirements. Clients can
benefit from a knowledgeable team comfortable with commodities in both physical
and derivative markets.
TransGraph customer base encompasses producers, traders, consumers, manufacturers,
smelters and value add processers resulting in a comprehensive knowledge and understanding
of all areas of the Base Metals markets. TransGraph has proven forecasting accuracy
across the base metals complex. The audit is done in a systematic and fool proof
fashion regularly and shared publicly. Our clients use our price forecast in making
their purchase decisions and save 3-4% on their procurement cost.
We track all base metals being traded on bench mark market LME. TransGraph delivers
regular market research reports on Copper, Aluminum, and Zinc & Lead.
Reports
Copper (Cu): Copper is the most actively watched commodity for its price behavior as its direction gives broad clues to the economic activity globally. Copper is being actively traded on LME Platform which also act as pricing bench mark globally. Copper has been a leading indicator for other base metals.
|
|
||

|
|||
Aluminum (Al): Aluminium is the second most abundant metallic element in the earth’s crust after silicon and is the world’s second most used metal. Aluminum being traded on LME is highly co-related with other Copper Prices.
|
|
||
|
|
|||
Lead (Pb): Industrial metal used in battery manufacturing is actively traded on LME and SHFE markets. Lead and Zinc find common applications and are highly co-related.
|
|
||
|
|
|||
Zinc (Zn): Zinc is commonly mined as a co-product with standard lead and is mainly used in galvanizing, which accounts for almost half its modern-day demand. It is the third largest traded contract on LME.
|
|
||
|
|
|||
Explore more...
- Commodity Research
MTMT | Customized Reports | Free Trial -
Base Metals
Reports | Features | Audit -
Crude Oil & Bio Diesel
Reports | Features -
Currency
Reports | Features | Audit -
Edible Oils & Oilseeds
Reports | Features | Audit -
Grains & Pulses
Reports | Features | Audit -
Iron & Steel
Reports | Features | Audit -
Lauric Oils and Oleochemicals
Reports | Features | Audit -
Mango
Reports | Features | Audit -
Milk
Reports | Features | Audit -
Natural Rubber
Reports | Features | Audit -
Paper & Paper Boards
Reports | Features | Audit -
Polymers
Reports | Features | Audit -
Sugar & Molasses
Reports | Features | Audit - Resources Center
Brochures | Case Studies | Conference Papers - Schedule an Analyst Interaction
- Promotions
Testimonials
“ I am writing to extend my thanks for the research and price forecasting services provided to us on a daily basis by Transgraph. The reports and information whether they are emailed to us daily or sourced via your website portal, are a consistent and reliable source of quality information. Our industry is one where information and its dissemination can help in differentiating between suppliers."
- Scott Yarwood, Sr. Regional Sales Manager, ADM Trading (UK) Ltd.
“ This is to state our appreciation for Transgraph for continuously delivering on its mandate to provide updated and insightful consulting services in the area of commodities and ingredients. I would also like to thank your team that is always in touch with buyers and feeds in relevant information that has been many times useful in decision making. In nutshell, the engagement with Transgraph has been enriching."
- V. Sridhar, Sector Manager, Commodities & Ingredients, Cadbury India Ltd.
“ By helping simulate the risk scenarios beforehand, TransRisk has added immense value to our trading decision making process at the operating level. The scenarios are comprehensive because one is able to view the basis and rollover risks associated with the hedged positions too. TransRisk also serves as good Dashboard for the top management, as it gives exposures, P&L, associated risk, limits all at one place.”
- S Sivakumar, CEO, Agri Business, ITC Limited
“ At risk framework and imputed risk model of TransRisk are definitely forward looking
and will enable us to move away from ‘post mortem’ approach. We can
take a business decision of pricing our contracts or purchasing in advance after
factoring in a quantifiable and acceptable risk instead of trying to find reasons
for the breach of limits."
"A flexible and scalable business intelligence that gives exposures, P&L,
associated risk, limits all at one place and this decision support system can be
integrated with our existing ERP and will avoid duplication of data entry.”
- Jude Magima, ED – Sourcing and Supply Chain, Dabur India Limited
“ Transgraph has showcased that ‘Risk Management’ is an excellent tool which will help any sourcing organization to deliver in any and even during challenging business scenario. They have succeeded in creating a deeper, specific and relevant input to the automotive sector. Highly recommended, the course was extremely detailed but the faculty made it so easy to understand - Top marks.”
- S.R. Rajan, Vice President-Commercial, TVS Srichakra Limited.
Features
| Features | Daily Price Outlook & Strategy | Weekly Price Outlook & Strategy | Weekly Elliott wave analyser | Monthly Long term outlook | |

|
Coverage | Global Markets CU, AL, PB, ZN | Global Markets CU, AL, PB, ZN | LME CU, AL, PB, ZN | Global Markets CU, AL, PB, ZN |
| Fundamental summary | Critical fundamental Factors; Fundamental outlook Index | Critical fundamental Factors; Fundamental outlook Index | Not Applicable (NA) | Supply & Demand Forecasts; Inventory; Sentiment index; Currency impact; Recent developments | |
| Technical summary | Technical analysis summary | Technical analysis summary | LME Elliott wave analyser summary | Technical outlook | |
| Price Direction |
LME: Price Direction Forecast MCX: Price Direction Forecast |
LME: Price Direction Forecast |
Elliott wave degrees: Cycle, Primary, Intermediate, Minor waves Price direction: 2, 4 and 6 Weeks |
LME: Price Direction Forecast | |
| Price range forecast | Price Range: 5 day & 10 day forecast | Price Range: 2 week, 1 & 2 months forecast | Price Range: 2 week | Price Range: 2 months forecast | |
| Strategy review | Review of previous strategy | Review of previous strategy | NA | Not Applicable (NA) | |
| Latest Strategy | LME & MCX : Trading strategy | LME & MCX : Generic procurement strategy | LME: Directional strategy | NA | |
| Performance Audit | LME & MCX Strike Rate; NP/GP ratio | LME & MCX Strike Rate; % savings | NA | NA | |
| Fundamental analysis | Yester session market review |
Comprehensive fundamental analysis Global Economy analysis |
NA | Metal production; Mine production; Capacity; Explorations; Mine Producers; Producers; S&D gaps; Consumption trends; Construction sector; Automobile sector; Stocks trends; Spreads; Forward Curves; TC/RC; Seasonality; China Arbitrage; Economic sentiments; New projects; Physical premiums; Chinese exports... | |
| Technical outlook | Detailed technical analysis and outlook on LME for short term | Detailed technical analysis and outlook on LME & MCX for medium term |
LME Elliott wave proffered count : Long term & Short term LME Elliott wave alternative count : Long term & Short term |
Elliott waves | |
| Calendar | Key Economic & Fundamental Data | Key Economic & Fundamental Data | NA | NA | |
| Mini Charts | Various must track data trends | Various must track data trends | NA | NA | |
| Facts & Figures | Most important market data | Most important market data | NA | NA | |
| Other | Not Applicable (NA) | CFTC COT analysis | NA | CFTC COT analysis | |
Audit
| Period | Strike Rate % | NP/GP % | Procurement Savings % | |||||
| 2012 YTD | 2007-12 YTD | 2012 YTD | 2007-12 YTD | 2012 YTD | 2007-12 YTD | |||
| Daily Copper Price Outlook & Strategy | 83% | 60% | 95% | 57% | NA | |||
| Weekly Copper Price Outlook & Strategy | 78% | NA | NA | 0.4% | 0.95% | |||
| Daily Aluminum Price Outlook & Strategy | 25% | 57% | 44% | 43% | NA | |||
| Weekly Aluminum Price Outlook & Strategy | 74% | NA | NA | 0.03% | 0.88% | |||
| Daily Lead Price Outlook & Strategy | 100% | 60% | 100% | 66% | NA | |||
| Weekly Lead Price Outlook & Strategy | NA | NA | 1.33% | 1.53% | ||||
| Daily Zinc Price Outlook & Strategy | 100% | 60% | 100% | 61% | NA | |||
| Weekly Zinc Price Outlook & Strategy | NA | NA | 0.35% | 0.8% | ||||
|
YTD: Year Till Date
Strike Rate %: Daily: Percentage of number of strategies made profit. Weekly: Percentage of number of months bettered the market average NP/GP %: {(Gross Profit - Gross Loss) / (Gross Profit)}X100 Procurement Savings %: {(Market average - TransGraph purchase price) / (Market average)}X100 |
||||||||
